Title
Tutto sulle pivot Excel: calcoli, analisi, PowerPivot
Il corso che ti insegnerà ad effettuare analisi dati dalle piu' semplici alle piu' complesse

What you will learn
Pivot di Excel semplici
Caratteristiche delle tabelle pivot
Formattazione dei dati
Filtri all'interno delle tabelle pivot
Pivot complesse generate dall'incrocio di due tabelle
Analisi dati
Mappe 3D per visualizzare su una cartina geografica i nostri dati
Power Pivot
Why take this course?
🌟 Il Corso Che Ti Insegnerà ad Effettuare Analisi Dati dalle Più Semplici alle Più Complesse: Tutto Sulle Pivot Excel! 🌟
Ciao e benvenuti nel mio corso online dedicato alle Pivot di Excel! 🚀 Se sei sempre cercato di scoprire il modo per organizzare, sintetizzare ed eccellere nella visualizzazione di great deal di informazioni in maniera chiaro e efficace, questo è il corso giusto per te.
📈 Nel corso esploreremo passo dopo passo:
- Come creare, modificare e personalizzare le tabelle pivot: Questi sono gli strumenti fondamentali per chiunque lavori con Excel a livello professionale. Imparerai a riepilogare dati complessi e generare report dinamici che accelereranno il processo decisionale.
- Tecniche pratiche, esercizi ed spiegazioni dettagliate: Il corso è concepito per utenti di tutti i livelli, dalla newbie all'esperto. Che tu sia alla ricerca di semplicare il tuo lavoro giornaliero o di approfondire l'analisi avanzata dei dati, tu troverai tutte le informazioni necessarie per diventare un maestro delle pivot in Excel.
- Uso efficace e sicuro delle pivot: Partendo dalle prime nozioni, finiremo con tecniche sofisticate, incluso l'utilizzo di Power Pivot, uno strumento molto avanzato che speed up il tuo lavoro quotidiano con passaggi semplici.
- Data visualization: Vedremo come rappresentare i dati su mappe geografiche e creare dashboard accattivanti, fatti che ti aiuteranno a dare vita ai tue dati! 📊
🚀 Perché scegliere questo corso?
- Comprensiva: Dal fondamento alla cima dell'analisi dati.
- Aggiornato: Concenzi all'avanguardia con le ultime funzioni di Excel.
- Diversificato: Esercizi pratici che coprono una varietà di situazioni reali, affinché tu tuoi preparato su ogni tipo di dati.
- Personalizzazione: Imparerai come adattare le tecniche delle pivot al proprio stile e alle esigenze del tuo lavoro.
🌍 Pronti a trasformare i vostri dati in informazioni utili? Iniziamo insieme questo viaggio nell'universo delle Pivot di Excel! Vi aspetto nel corso per affiancarvi e guidarvi passo after passo verso il mastering delle pivot! 🎉
Non perdere questa opportunità: unisciti al corso "Tutto sulle Pivot di Excel" e trasforma i tue competenze nel dati analysis! Ci vediamo lì!
Screenshots


Our review
Overall Course Rating: 4.31/5
Course Review Summary: The course on Excel Pivot Tables and Dashboards has been highly rated by recent students, with an average rating of 4.31 out of 5 stars. The reviews highlight the course's clear structure, depth of content, and the practical utility of the skills taught. Most reviewers found the course material to be well-prepared, offering valuable insights into automating data operations and enhancing information presentation with dynamic effects on graphs, which were previously unfamiliar to them.
Pros:
-
Content Coverage: The curriculum was comprehensive and met or exceeded the expectations of students, covering all essential aspects of Pivot Tables and Dashboards within Excel.
-
Clarity and Organization: Modules were articulated clearly, with an emphasis on practical application in real-world scenarios, making the course highly applicable to everyday professional tasks.
-
Engaging Instruction: The instructor was described as knowledgeable and engaging, providing clear explanations and utilizing a variety of resources that supported the learning process effectively.
-
Material Quality: Students appreciated the inclusion of exercises and files for practical application, which allowed them to actively engage with the material and apply the concepts learned directly.
-
Skill Acquisition: The course was praised for its ability to equip students with new skills that could be immediately applied to their work in data analysis, reporting, and decision-making processes.
Cons:
-
Structure of Instruction: Some students felt the course had a few disorganized explanations or areas that appeared slightly out of alignment, indicating that while the content was valuable, the presentation could have been optimized for clarity.
-
Exercise Count: A few reviewers suggested adding more exercises to reinforce the concepts learned throughout the course and to provide additional practice opportunities.
-
Desire for Additional Resources: Several students expressed a hope for more courses on related topics such as KPIs, data analysis in commercial/sales contexts, and advanced Excel skills.
In conclusion, this Excel Pivot Tables and Dashboards course is highly recommended for both beginners and those looking to refine their skills in data manipulation within Excel. With its comprehensive coverage of essential concepts and practical examples, it is a valuable resource for professionals across various industries who handle data analysis daily. Enrica Gonella's contribution as an instructor was also a highlight, with many students expressing their appreciation for her professionalism and the passion she brought to the course material.
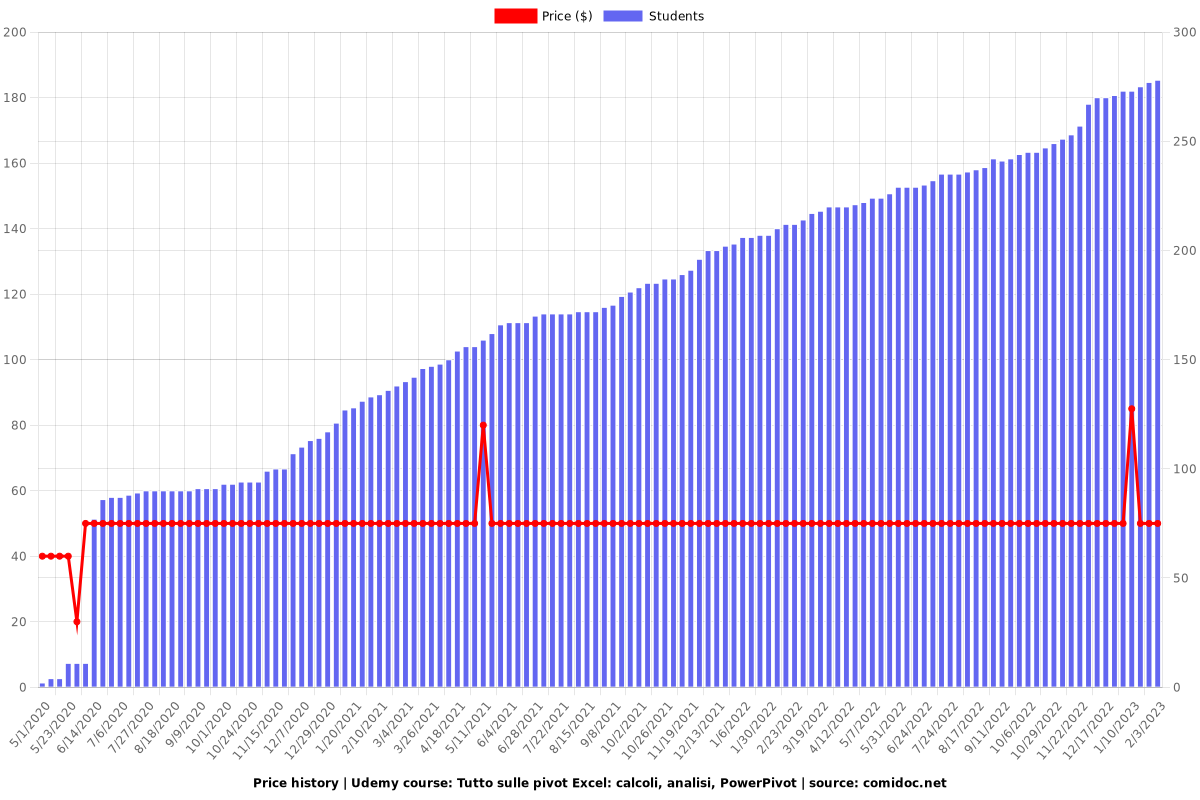
Charts
Price
Rating

Enrollment distribution