Data Analysis Bootcamp™ 21 Real World Case Studies

Gain Business Intelligence Skills using Statistics, Data Wrangling, Data Science, Visualizations & Google Data Studio

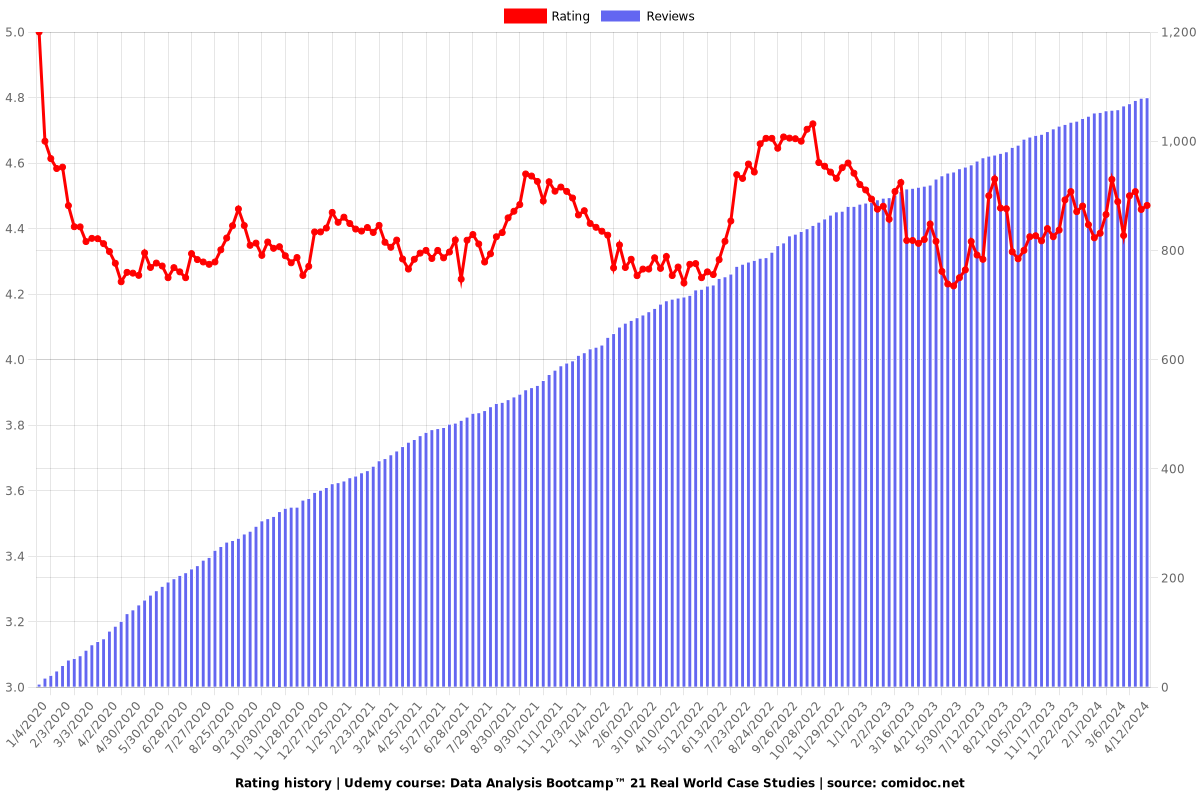
4.54 (1080 reviews)
Udemy
platform
English
language
Data & Analytics
category
instructor
Data Analysis Bootcamp™ 21 Real World Case Studies
9,474
students
21 hours
content
Sep 2021
last update
$84.99
regular price

What you will learn

Understand the value of data for businesses

The importance of Data Analytics

The role of a Data Analyst

Learn to use Python, Pandas, Matplotlib & Seaborn, Scikit-learn

Learn Visualization Tools such as Matplotlib, Seaborn, Plotly and Mapbox

Hypothesis Testing and A/B Testing - Understand t-tests and p values

Unsupervised Machine Learning with K-Means Clustering

Machine Learning from Linear Regressions (polynomial & multivariate), K-NNs, Logistic Regressions, SVMs, Decision Trees & Random Forests

Advanced Pandas techniques from Vectorizing to Parallel Processsng

Statistical Theory, Probability Theory, Distributions, Exploratory Data Analysis

Ananlytic Case Studies involving Retail, Health, Elections, Sports, Resturants, Airbnb, Uber and more!

Full Tutorial on Google Data Studio for Dashboard Creation

Why take this course?

Data Analysts aim to discover how data can be used to answer questions and solve problems through the use of technology. Many believe this will be the job of the future and be the single most important skill a job application can have in 2020.

In the last two decades, the pervasiveness of the internet and interconnected devices has exponentially increased the data we produce. The amount of data available to us is Overwhelming and Unprecedented. Obtaining, transforming and gaining valuable insights from this data is fast becoming the most valuable and in-demand skill in the 21st century.

In this course, you'll learn how to use Data, Analytics, Statistics, Probability, and basic Data Science to give an edge in your career and everyday life. Being able to see through the noise within data, and explain it to others will make you invaluable in any career.

We will examine over 2 dozen real-world data sets and show how to obtain meaningful insights. We will take you on one of the most up-to-date and comprehensive learning paths using modern-day tools like Python, Google Colab and Google Data Studio.

You'll learn how to create awesome Dashboards, tell stories with Data and Visualizations, make Predictions, Analyze experiments and more!

Our learning path to becoming a fully-fledged Data Analyst includes:

  1. The Importance of Data Analytics

  2. Python Crash Course

  3. Data Manipulations and Wrangling with Pandas

  4. Probability and Statistics

  5. Hypothesis Testing

  6. Data Visualization

  7. Geospatial Data Visualization

  8. Story Telling with Data

  9. Google Data Studio Dashboard Design - Complete Course

  10. Machine Learning - Supervised Learning

  11. Machine Learning - Unsupervised Learning (Clustering)

  12. Practical Analytical Case Studies

Google Data Studio Dashboard & Visualization Project:

  1. Executive Sales Dashboard (Google Data Studio)

Python, Pandas & Data Analytics and Data Science Case Studies:

  1. Health Care Analytics & Diabetes Prediction

  2. Africa Economic, Banking & Systematic Crisis Data

  3. Election Poll Analytics

  4. Indian Election 2009 vs 2014

  5. Supply-Chain for Shipping Data Analytics

  6. Brent Oil Prices Analytics

  7. Olympics Analysis - The Greatest Olympians

  8. Home Advantage Analysis in Basketball and Soccer

  9. IPL Cricket Data Analytics

  10. Predicting the Soccer World Cup

  11. Pizza Resturant Analytics

  12. Bar and Pub Analytics

  13. Retail Product Sales Analytics

  14. Customer Clustering

  15. Marketing Analytics - What Drives Ad Performance

  16. Text Analytics - Airline Tweets (Word Clusters)

  17. Customer Lifetime Values

  18. Time Series Forecasting - Demand/Sales Forecast

  19. Airbnb Sydney Exploratory Data Analysis

  20. A/B Testing


Screenshots

Data Analysis Bootcamp™ 21 Real World Case Studies - Screenshot_01Data Analysis Bootcamp™ 21 Real World Case Studies - Screenshot_02Data Analysis Bootcamp™ 21 Real World Case Studies - Screenshot_03Data Analysis Bootcamp™ 21 Real World Case Studies - Screenshot_04

Reviews

Pratiksha
March 26, 2023
The instructor scrolls up and down the Jupyter notebook a lot, causing a lapse of concentration among the viewers and ultimately confusion.
Kumar
November 1, 2022
Just reading from the slides and notebook ,don't buy the course and save the time and money. What are you trying to convey?
Rodrigo
September 18, 2022
I swear to God, if I hear "that's pretty cool"/"that's cool" one more time, I'll jump out the window. :)
Dilnoza
September 4, 2022
Section 4.18. The author notes that axis=0 for columns and axis=1 for rows. It's the opposite: “axis 0” represents rows and “axis 1” represents columns. The I'm not convinced if the author knows what he's teaching((
Oğuz
June 21, 2022
I think the course is very well. Firstly, when i bought this course, i thought google data studio and python would be related. It is not related. Each topic is diffirent. Secondly, how to use python api for data visualization could be shown in tools like facebook, google. Finally, I like last topic. Because, flourish has been explained. The data is beautifully visualized. I'm wondering this, In real-time applications, how is the data captured instantly and the data visualization process is done there? During the course, constant data analysis was made.
Brandon
January 17, 2022
Good overview of basic Pandas functions. Need to get a list of "all" of them and bookmark the ones I think I will use the most.
Vinayak
January 10, 2022
Some suggestions are as follows: 1. Divide the learning part and use case sections 2. Make the content more engaging Overall a good course with practical example, but can be improved
Augusto
November 24, 2021
It's is ok, but almost all the time he's reading the slides and the code. It's interesting but not enjoyable.
Pedro
November 8, 2021
Excellent course. Super complete. After some previous courses, and models, I could reinforce my understanding in several topics thanks to their explenaitions during lectures. Also excellent materials provided such as slides ando python notebooks to explore and make our own experience
Erik
September 15, 2021
Good course, covers a lot of concepts. Could be better organized, as it seems to be an assembly of videos from other course. Could say the same with the videos themselves with the instructor getting lost at points, but overall quite good. Just a side note, maybe try less wild scrolling, makes it hard to watch and try to integrate some quizzes and more homework
Benjamin
July 28, 2021
Amazing course with a lot of theory and useful examples. The theory is boiled down to what is really needed for the later application and backed up with interesting examples. At first I felt a bit discouraged by the length of the course, but it actually went by pretty quickly due to the interesting content.
Ramprasath
June 9, 2021
The course is really indepth so far. Highly recommended. If you are looking to start with quick basics, then dial in deep into data analytics, this is the course for you.
Kumar
March 26, 2021
Extremely awful experience. Neither the tutor is properly audible nor he is explaining things properly. For instance: He imports a file from GitHub to do some actions, now what the file is, how can we do something on it, how to write the code? nothing is clear. He just reads out the code he has written already. Sheer waste of time.
Jainam
March 5, 2021
Case Studies should be explained properly ,if we only wanted to read code we could have used another platform
Kim
February 26, 2021
The content of the course was amazing the structure especially towards the end confusing as of the 21 cases presented only 5 had a walkthrough

Charts

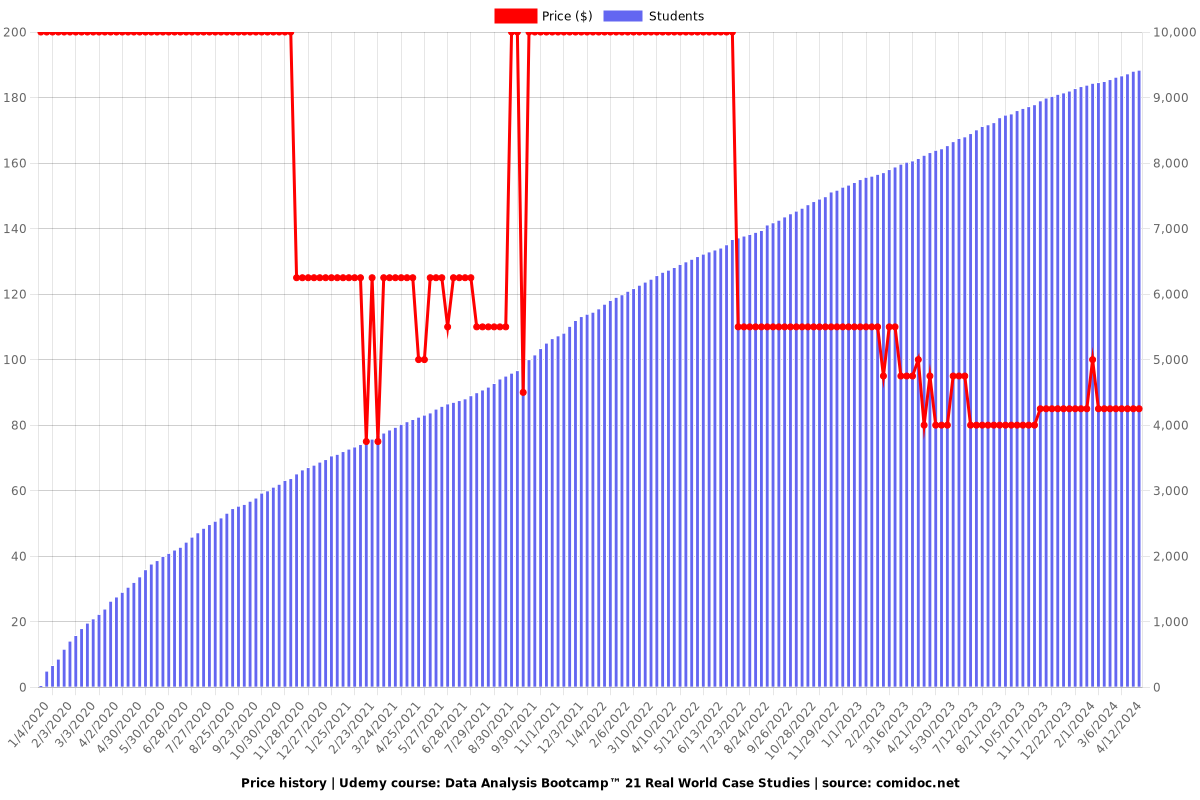
Price

Data Analysis Bootcamp™ 21 Real World Case Studies - Price chart

Rating

Data Analysis Bootcamp™ 21 Real World Case Studies - Ratings chart

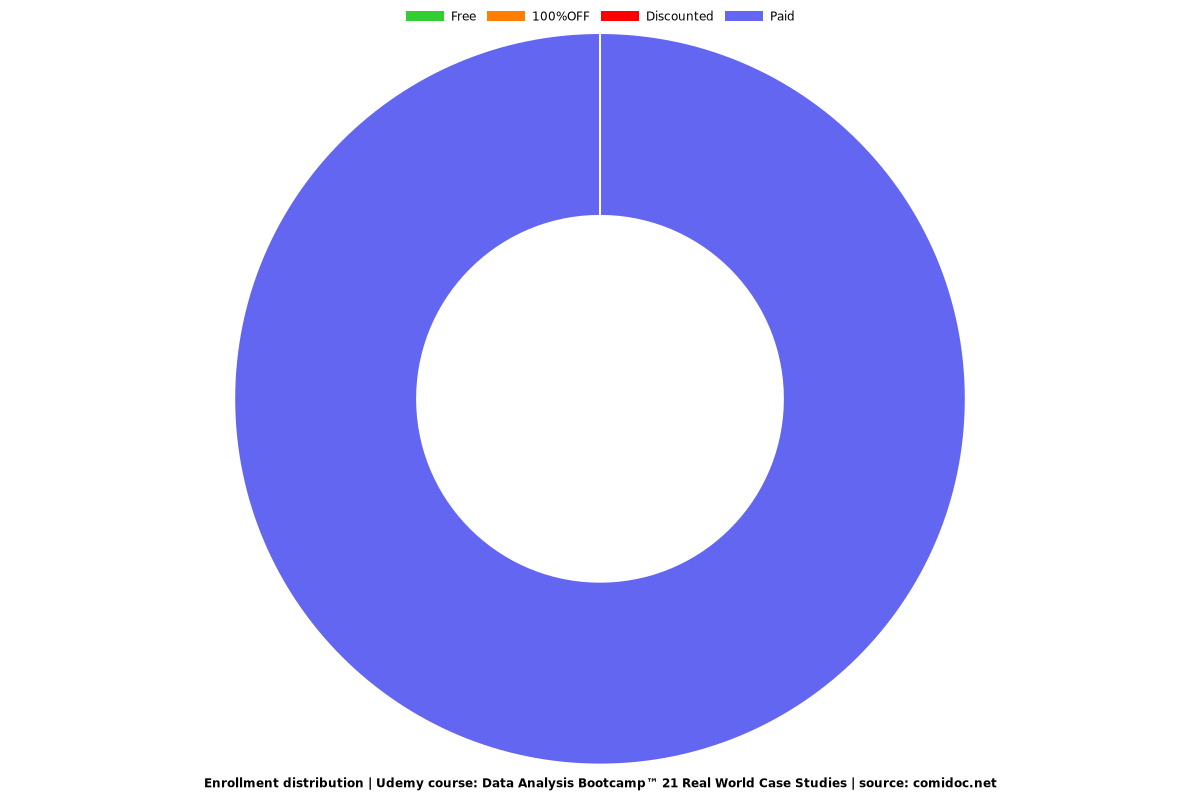
Enrollment distribution

Data Analysis Bootcamp™ 21 Real World Case Studies - Distribution chart
2694796
udemy ID
12/8/2019
course created date
1/4/2020
course indexed date
Bot
course submited by