Text Mining and Sentiment Analysis with Tableau and R
Data Science with R and Tableau: Extract valuable info out of Twitter to rock in marketing, finance, or any research.

What you will learn
Connect Twitter and R to harvest Tweets for certain keywords
Perform sentiment analysis based on a simple lexicon approach
Clean and process Tweets for further analysis
Export text based data and sentiment scores from R
Use Tableau to visualize sentiment analysis data
Identify situations where sentiment analysis can be applied in a company
Why take this course?
Extract valuable info out of Twitter for marketing, finance, academic or professional research and much more.
This course harnesses the upside of R and Tableau to do sentiment analysis on Twitter data. With sentiment analysis you find out if the crowd has a rather positive or negative opinion towards a given search term. This search term can be a product (like in the course) but it can also be a person, region, company or basically anything as long as it is mentioned regularly on Twitter.
While R can directly fetch the text data from Twitter, clean and analyze it, Tableau is great at visualizing the data. And that is the power of the method outlined in this course. You get the best of both worlds, a dream team.
Content overview and course structure:
The R Side
Getting a Twitter developers account
Connection of Twitter and R
Getting the right packages for our approach
Harvesting Tweets and loading them into R
Refining the harvesting approach by language, time, user or geolocation
Handling Twitter meta data like: favorites, retweets, timelines, users, etc
Text cleaning
Sentiment scoring via a simple lexicon approach (in English)
Data export (csv) for further Tableau work
Tableau Side:
Data preparation for visualizations
Quick data exploration
Dashboards
Visualizing -
- Popularity of different products
- Popularity between different locations on a map
- Changes in popularity over time
You only need basic R skills to follow along. There is a free version of Tableau called Tableau public desktop, or even better: as a full time college student you can get a free but full version of Tableau desktop professional.
The course comes with the R code to copy into your R session.
Disclaimer required by Twitter: 'TWITTER, TWEET, RETWEET and the Twitter logo are trademarks of Twitter, Inc or its affiliates.'
Reviews
Charts
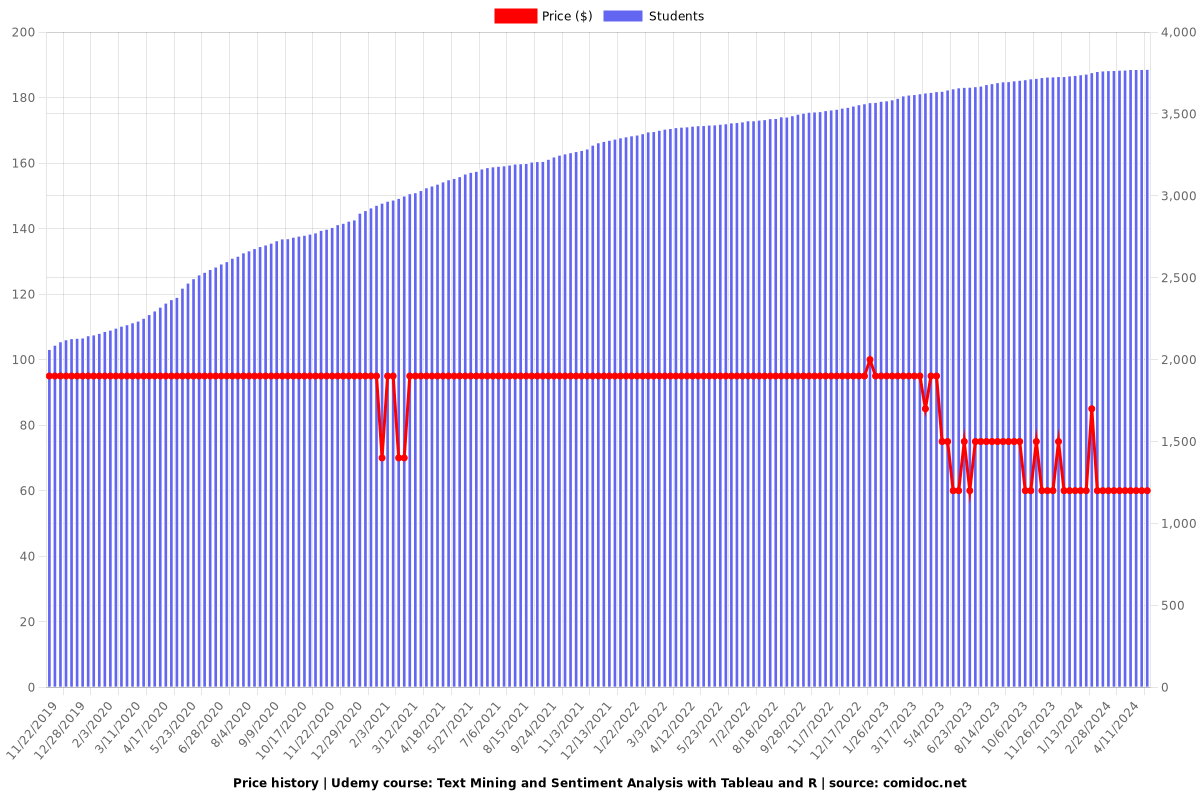
Price
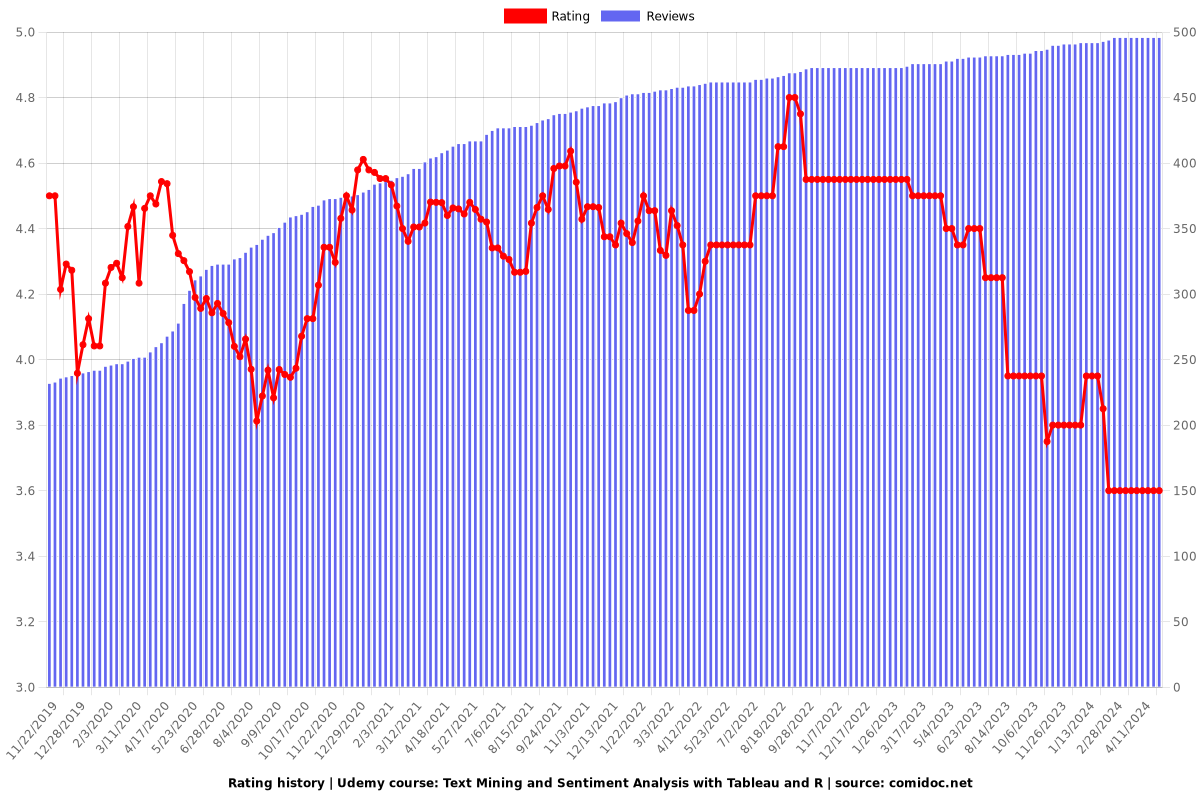
Rating
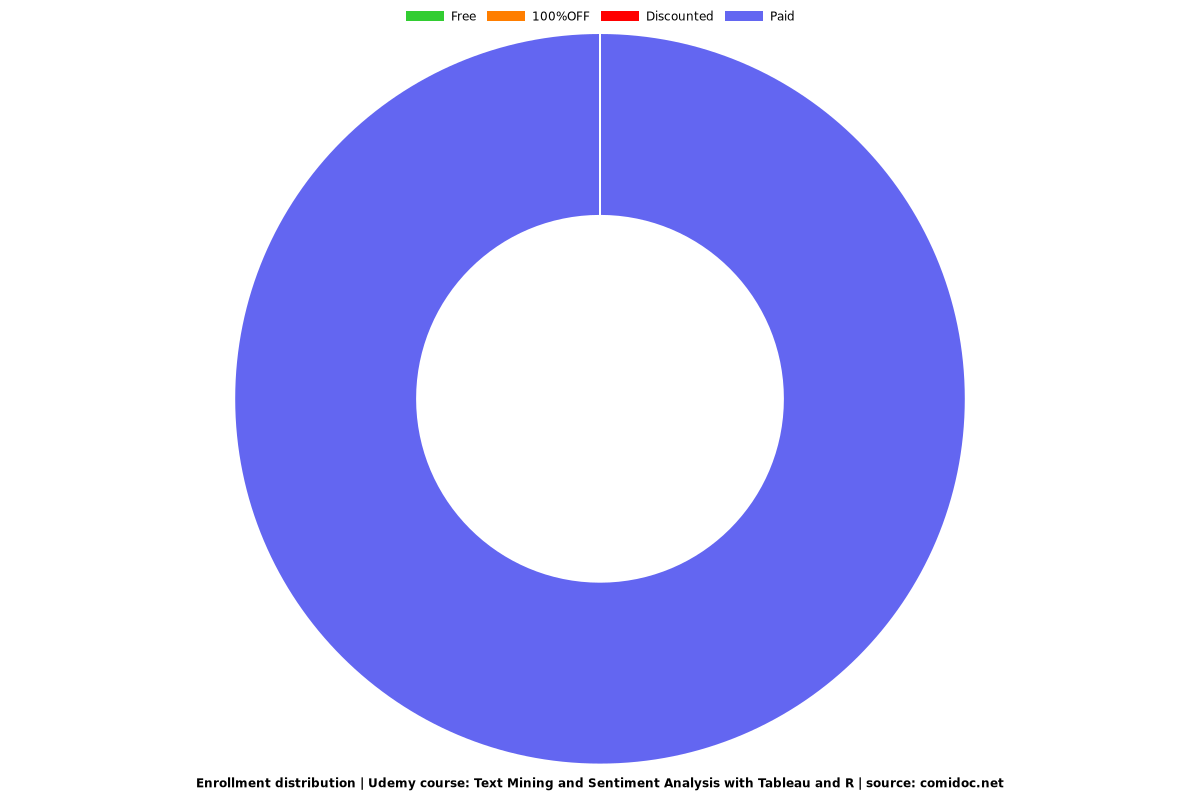
Enrollment distribution