Title
Tableau Desktop Hands-on Training for Absolute Beginners
Learn Tableau 2024 for data science step by step from scratch. A comprehensive course to get you started with Tableau.

What you will learn
Connect Tableau to various Datasets
Create Bar Charts, Area Charts, Maps, Scatterplots, Pie Charts
Create Storylines
Create Dashboards
Create Calculated Fields
Create Table Calculations
Create Dual Axis Charts
Creating Data Extracts in Tableau
Understand Data Hierarchies, Aggregation, Granularity and Level of Detail
Adding Actions to Dashboards
Adding Filters- Discrete, Continuous and Dates
Assigning Geographical Roles to Data elements
Change the data type and default properties for fields
Creating Parameters
Use Colors, Bold, Fonts and Shapes
Dates- Date Parts vs Date values
Creating groups
Renaming a Data Field, Creating Aliases
Why take this course?
Course Title: Tableau Desktop Hands-On Training for Absolute Beginners 🚀
Course Headline: 🎓 Learn Tableau 2022 for Data Science - A Comprehensive Course to Kickstart Your Analytics Journey!
Course Description:
Unlock the Power of Data with Tableau Desktop!
- Understand the Interface: Gain a quick overview of the Tableau platform and become familiar with its user-friendly interface.
- Connect & Transform Data: Learn to connect to various data sources, perform data transformations, and prepare your datasets for analysis.
- Visualize Your Data: Master the art of creating a multitude of visualizations, including bar charts, scatter plots, histograms, line charts, and more, with an emphasis on best practices for clarity and impact.
- Analyze with Confidence: Utilize sorting, filtering, grouping tools to uncover insights hidden within your data.
- Present with Interactive Dashboards: Develop interactive dashboards that allow stakeholders to explore the data themselves, making your presentation more engaging.
- Tell a Story with Data: Create compelling, persuasive stories using Tableau's storytelling features, ensuring your insights are communicated effectively.
- Optimize for Different Devices: Learn how to create device layouts that allow your dashboards to be used across various devices without losing their effectiveness.
What You Will Learn:
- 🔍 Data Connection & Transformation: Understand how to connect to different data sources and clean your data.
- 📊 Visualization Mastery: Build, format, and enhance various types of visualizations to communicate your findings clearly.
- 🌟 Viz Animations: Create visually appealing animations within your visualizations to bring your data to life.
- 📈 Advanced Techniques: Explore hierarchies, sets, and calculated fields to perform sophisticated data analysis.
- 🎨 Customization & Aesthetics: Enhance the look of your dashboards with custom colors and fonts to tailor the presentation to your audience.
- 💡 Dynamic Dashboards: Develop interactive, dynamic dashboards that allow users to explore the data themselves.
- 📖 Storytelling with Data: Craft compelling narratives around the insights you have discovered.
- ✅ Device Layouts: Optimize your dashboards for a range of devices, ensuring they are both versatile and user-friendly.
By the End of This Course, You Will Be Able To:
- Confidently use Tableau Desktop to connect to a variety of data sources.
- Perform essential data transformations.
- Create insightful visualizations and interactive dashboards.
- Tell engaging stories with your data, captivating your audience.
- Optimize your work for different devices and screen sizes.
Why Choose This Course?
This comprehensive course is designed to take you from zero to hero in Tableau Desktop. With a mix of theoretical knowledge and practical application, you will be equipped with the skills needed to tackle real-world data challenges. Whether you're aiming to enhance your professional skill set or embark on a new career path in data science, this course is your stepping stone to success! 🌟
Enroll Now to Embark on Your Data Visualization Adventure with Tableau Desktop!
Our review
Overall Course Rating: 4.90/5.0
This online Tableau course has garnered an exceptional level of satisfaction among its participants, with all recent reviews rating it highly. The course is praised for its practicality and ease of use, making it a suitable choice for those who have prior experience with tools like Diver and Crystal Reporting, or for beginners looking to dive into data visualization.
Pros:
- Great for Beginners and Experienced Users Alike: The course is recommended for individuals at different levels of proficiency, from complete beginners to those with some background in reporting tools.
- Clear and Simple Explanations: The course content is commended for its clarity, making complex concepts easy to understand.
- Comprehensive Learning Structure: The curriculum covers basic to intermediate levels, ensuring a thorough understanding of the tool by the end of the course.
- Interactive Learning Experience: Participants appreciate the hands-on teaching approach and step-by-step guidance provided throughout the course.
- Specialized Content: The inclusion of a Viz animation module is highlighted as a unique feature that sets this course apart, adding an element of creativity to data visualization.
- Effective Combination of Theory and Practice: The balance between theoretical knowledge and practical exercises is credited with enabling quick confidence gain and immediate application of learned skills.
- High Quality Instruction: The expertise of the instructor is noted as a significant contributing factor to the course's success.
Cons:
- Lack of Closed Captions: One reviewer pointed out that closed captions would enhance the learning experience, especially for those who prefer visual aids to auditory instructions.
- Pacing Might Be Slower for Some: A few users found the pace of the course too slow, leading to occasional feelings of drowsiness despite the high-quality content.
Course Highlights:
- "Good Match for Me" - The course aligns well with users' expectations and experience levels.
- "Amazing Course with Clear Explanation" - The instructional method is highly praised for its effectiveness in teaching Tableau to newcomers.
- "Recommended for Absolute Beginners" - The simplicity of the explanation makes it accessible even for those who are just starting out.
- "Well Explained and Highly Recommended" - The course structure and content are endorsed for their quality and learning outcomes.
- "Outstanding Course with Viz Animation Module" - The innovative teaching on data visualization animation is a standout feature that adds significant value to the course.
In conclusion, this Tableau course stands out as an exceptional educational tool for individuals looking to learn or improve their skills in data visualization and reporting. With its comprehensive curriculum, clear instruction, and hands-on approach, it prepares users effectively for real-world applications of Tableau. While there is room for minor improvements such as the addition of closed captions, the course's overall quality has been widely recognized and appreciated by learners.
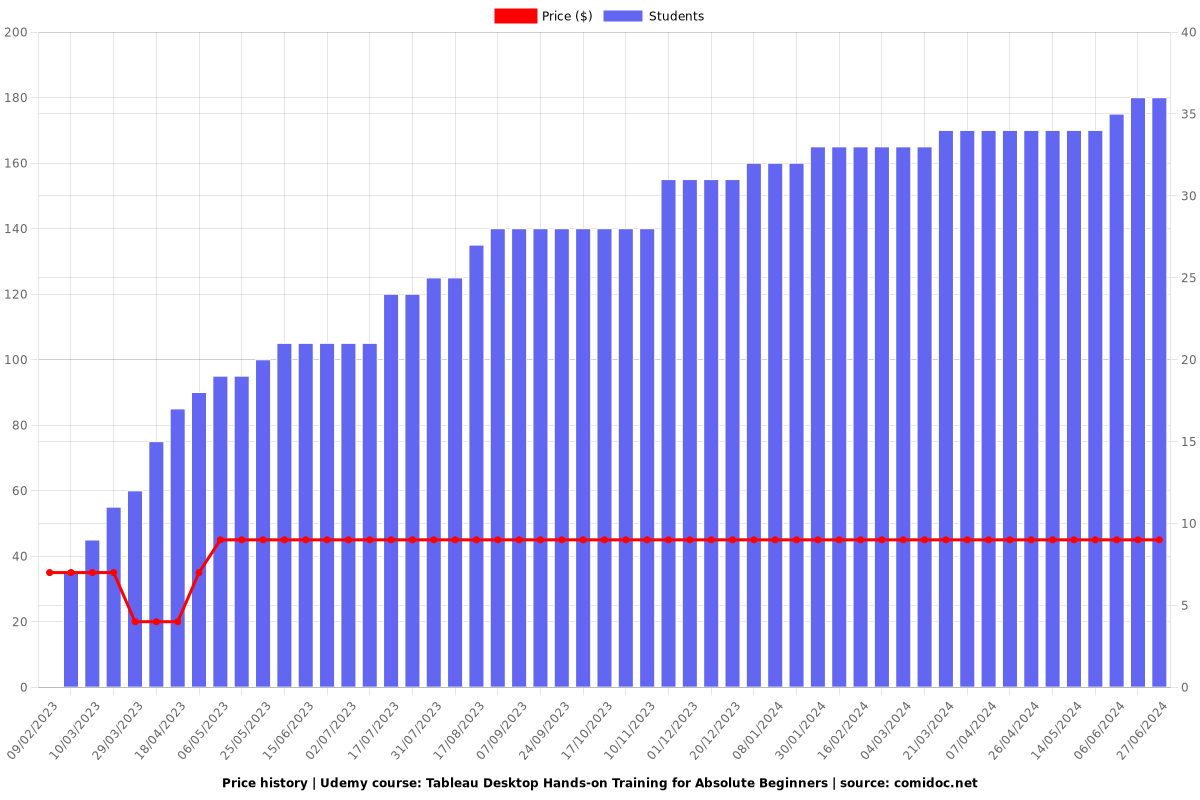
Charts
Price
Rating

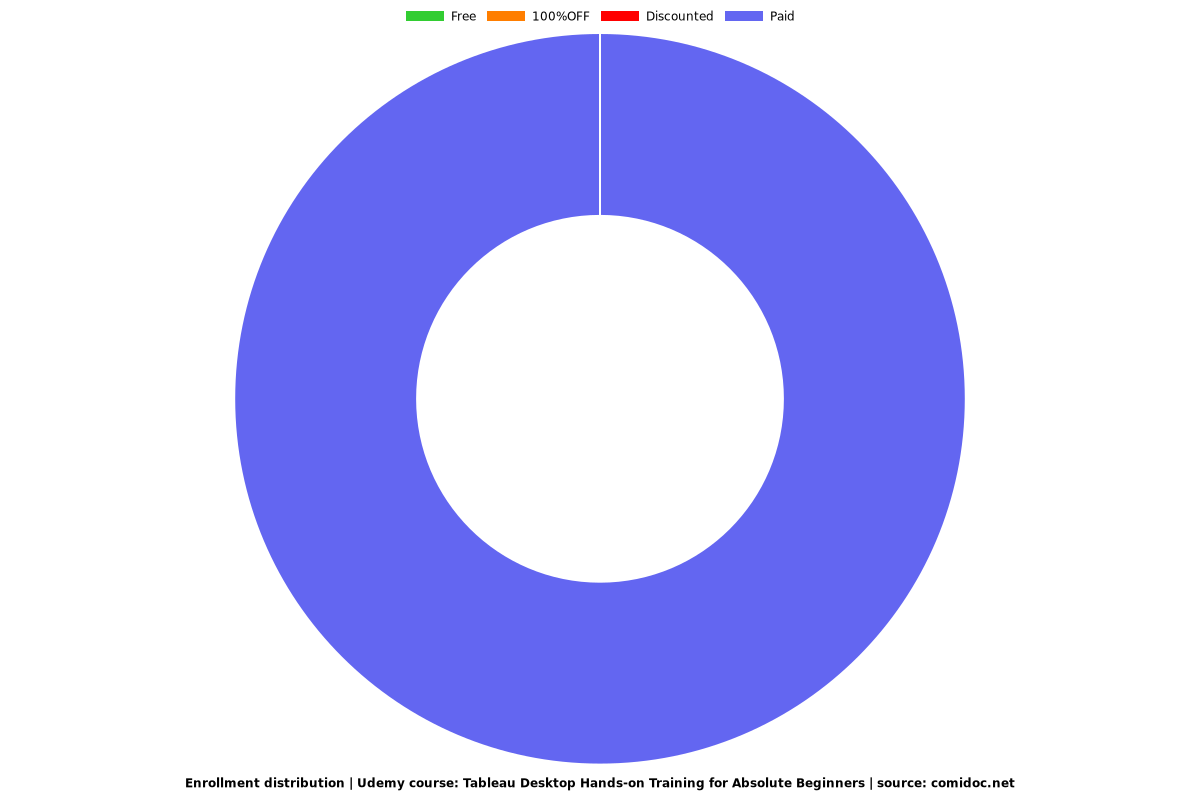
Enrollment distribution
Coupons
| Submit by | Date | Coupon Code | Discount | Emitted/Used | Status |
|---|---|---|---|---|---|
| - | 23/04/2023 | 4D82890A63F596315E0A | 71% OFF | expired | |
| - | 27/04/2023 | 9607A6E922A9CD6130EE | 78% OFF | expired | |
| - | 08/05/2023 | 09026E49EEA6ED317483 | 71% OFF | expired | |
| - | 02/07/2023 | C7553A333626F430C95C | 69% OFF | expired |