SAS for Statistics
SAS for Statistical Concepts and Data Visualization

What you will learn
Introduction to statistical analysis using SAS
Use of Statistics In Data Science
Use of Statistics in Decision Making
Descriptive Statistics - concepts and use cases
Central Tendency - Mean, Median and mode
Mean, Median and mode - implementation using SAS
Measures of Variance - Range, Quartiles, Percentiles, Variance and Standard Deviation
Range, Quartiles, Percentiles, Variance and Standard Deviation - Using SAS code
Exploratory Data Analysis
Data Visualization using SAS
Bar charts, Bar and Line charts, Bubble chart and scatter plot implementation in SAS
Inferential Statistics
Statistics use cases in different industries
Probability - Random Variable and Probability Distribution
Sampling - Sampling Techniques and Stratified Sampling
Sampling implementation using SAS
Why take this course?
This course is intended to give you an overview and detailed walkthrough of the various statistical concepts, data visualization techniques along with its implementation in SAS that are necessary for anyone interested in career of Marketing Analyst, a Business Intelligence Analyst, a Data Analyst, or a Data Scientist.
After this course, you will clearly know the statistical concepts discussed and be able to relate and think of real time use cases of those concepts across different industries.
Also, with implementation of these statistical concepts in SAS programming language, you will get an edge over the industry required skills to implement and visualize the data.
This course will help you to understand and learn:
Statistical analysis using SAS
Use of Statistics In Data Science
Use of Statistics in Decision Making
Descriptive Statistics - concepts and use cases
Central Tendency - Mean, Median and mode
Mean, Median and mode - implementation using SAS
Measures of Variance - Range, Quartiles, Percentiles, Variance and Standard Deviation
Range, Quartiles, Percentiles, Variance and Standard Deviation - Using SAS code
Exploratory Data Analysis
Data Visualization using SAS
Bar charts, Bar and Line charts, Bubble chart and scatter plot implementation in SAS
Inferential Statistics
Statistics use cases in different industries
Probability - Random Variable and Probability Distribution
Sampling - Sampling Techniques and Stratified Sampling
Sampling implementation using SAS
Hope you will get the intended learning out of this course!
Reviews
Charts
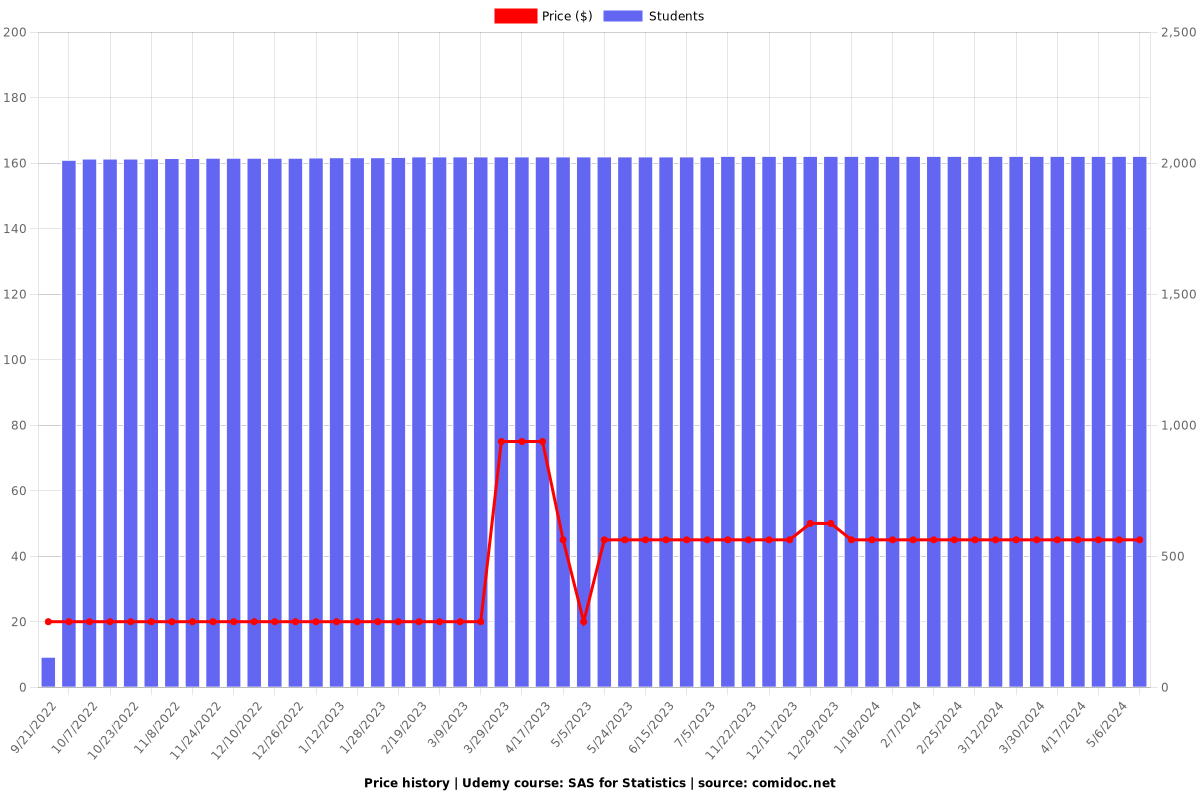
Price
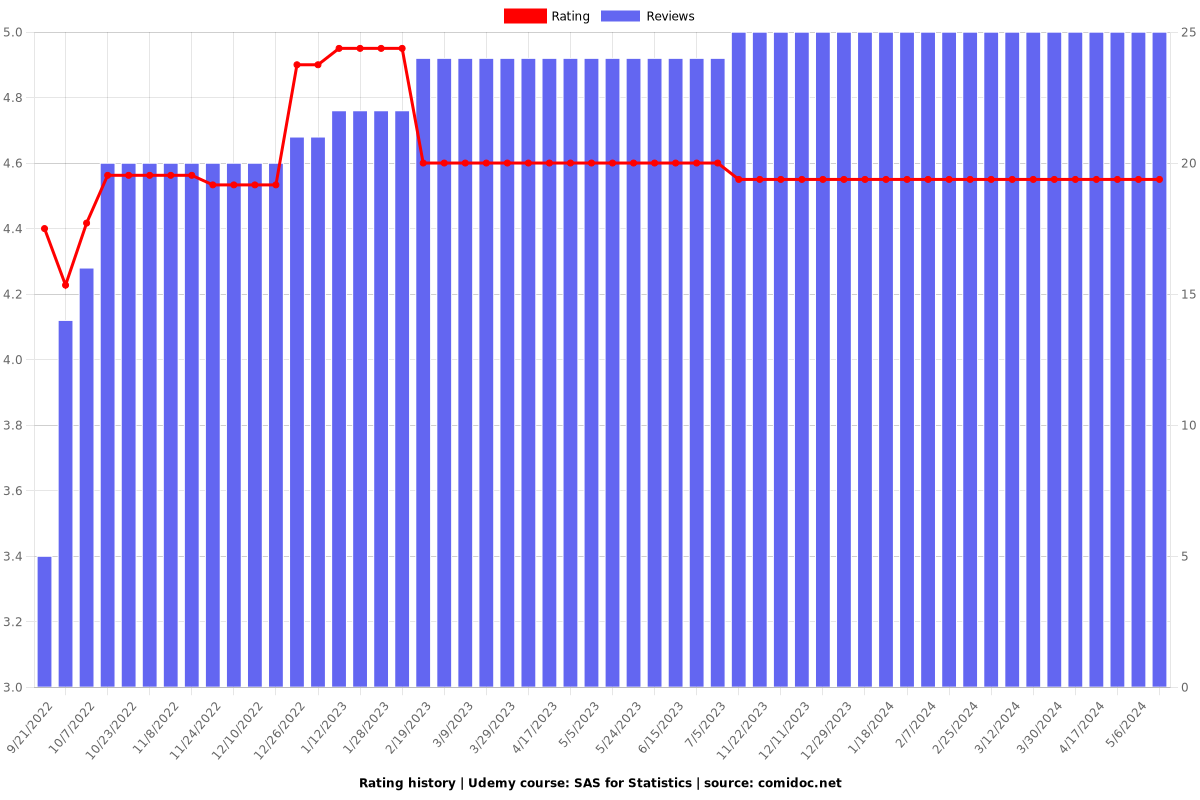
Rating
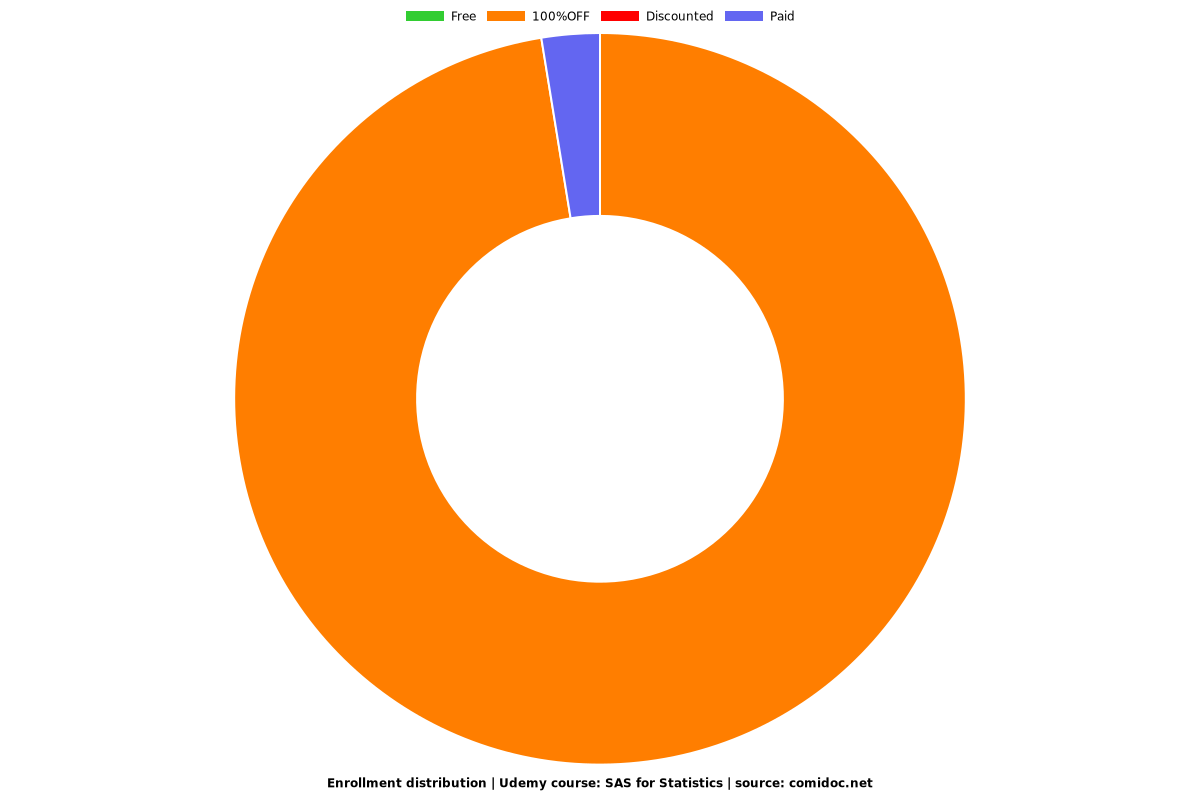
Enrollment distribution