Root Cause Analysis and the 8D Problem Solving Bootcamp
Four RCA approaches for permanent and effective corrective actions | Includes FMEA, VSM and Seven Basic Quality Tools

What you will learn
Perform the root cause analysis to eliminate the problem permanently
Choose the right tool for the root cause analysis
Learn about more than 40 tools that can be used for problem solving
Proven problem solving approaches
Taking permanent corrective actions, so that the problem does not come back again.
Templates are included in the course.
Why take this course?
Note: Students who complete this course have an option to apply for the certification exam by Quality Gurus Inc. and can achieve the Verified Certification from Quality Gurus Inc. It is optional and there is no separate fee for that.
Root Cause Analysis and the 8D Problem Solving Bootcamp
In this course I will cover four broad strategies or approaches for Root Cause Analysis (RCA) and problem-solving:
1. Five Why's
2. Cause and Effect Diagram
3. A3 Problem Solving Approach
4. Eight Disciplines or 8D Problem Solving Approach
Depending upon the complexity of the problem you can choose one of these approaches.
While taking these approaches, there are many tools and techniques which could be applied. I will cover many such tools, for example:
1. Seven Basic Quality Tools (Cause and Effect Analysis, Flow Chart, Check Sheet, Pareto Chart, Scatter Plot, Control Charts and Histograms)
2. Descriptive Statistics (Mean, Mode, Median, Range and Standard Deviation)
3. Graphs and Charts (Box and Whisker Plot, Individual Value Plot, Bar Chart, Pie Chart, Bubble Chart, Matrix Plot, and Time Series)
4. Value Stream Mapping
5. Tools for D1 (Establish the Team): Team Roles, Team Stages, Conflict Management and Negative Team Behaviours
6. Tools for D2 (Describe the Problem): 5W2H, SIPOC, Gemba Walk and Stakeholder Analysis
7. Tools for D3 (Interim Containment): Identification and Traceability
8. Tools for D4 (Root Cause Analysis): Brainstorming, Nominal Group Technique and Affinity Diagram
9. Tools for D5 (Develop CA): Poka-yoke, Force Field Analysis, Control Plan and Benefit-Cost Analysis
10. Tools for D6 (Implement CA): Gantt Chart, RACI Matrix, Reports and Dashboard
11. Tools for D7 (Prevent Recurrence): FMEA
Screenshots


Reviews
Charts
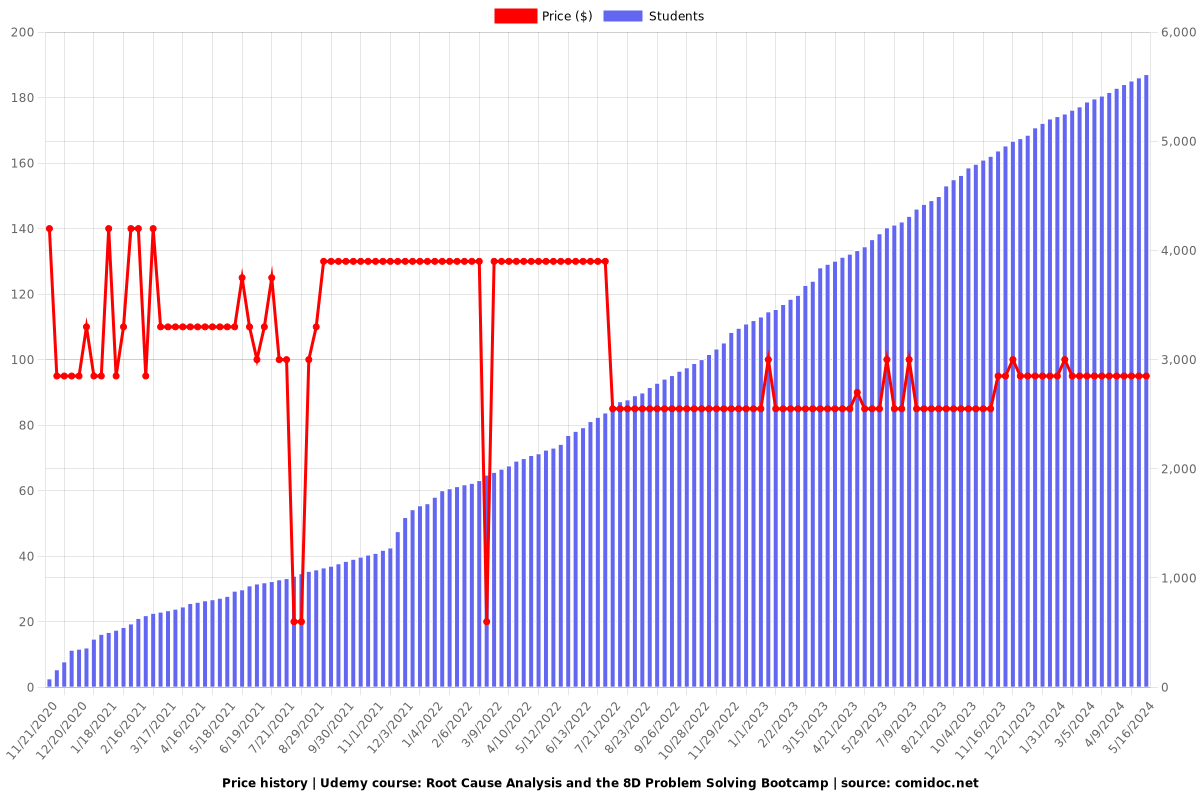
Price
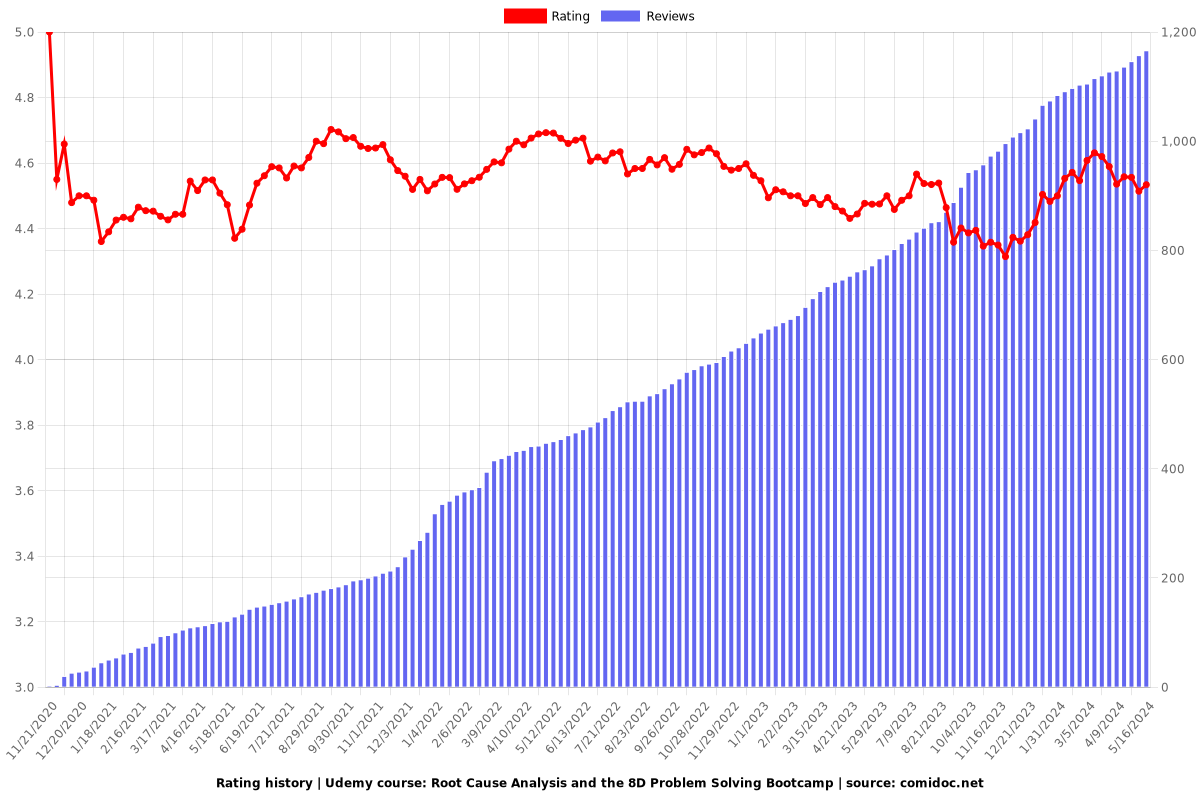
Rating
Enrollment distribution