R Shiny Interactive Web Apps - Next Level Data Visualization
Learn how to use R and Shiny to create compelling data visualizations and how to share them online.
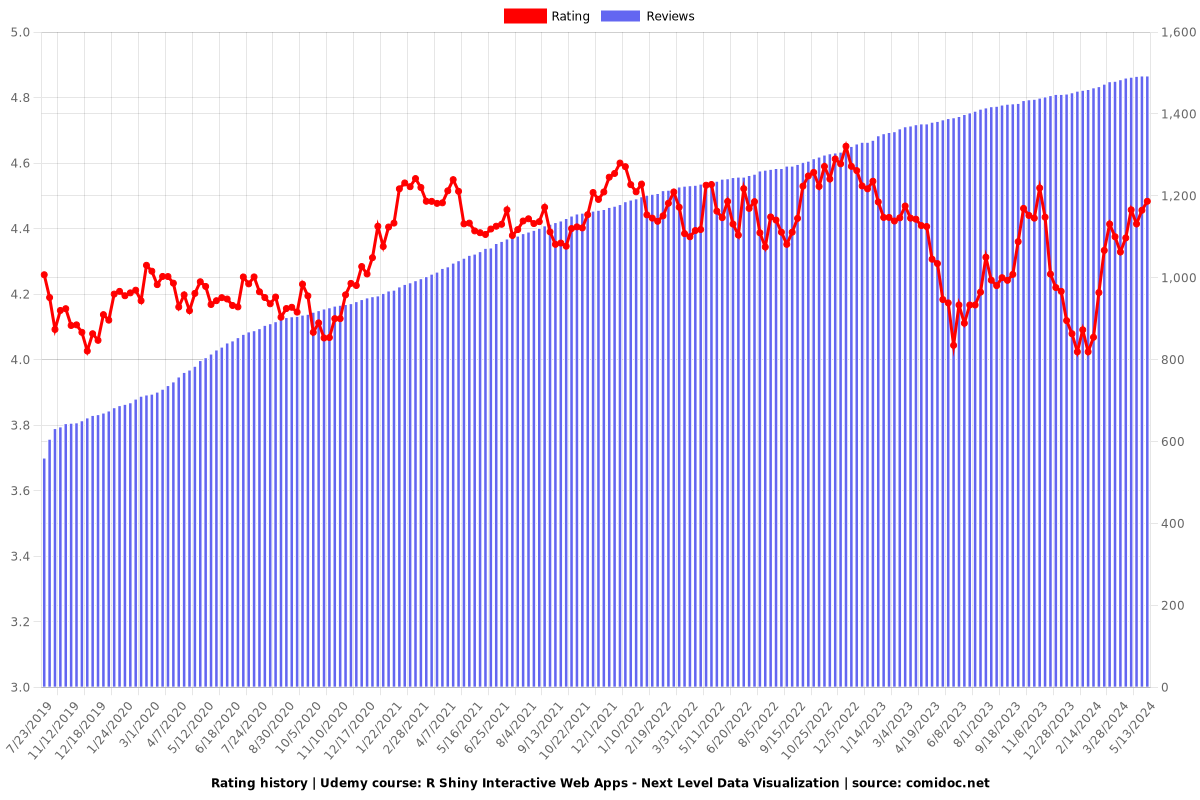
4.41 (1492 reviews)

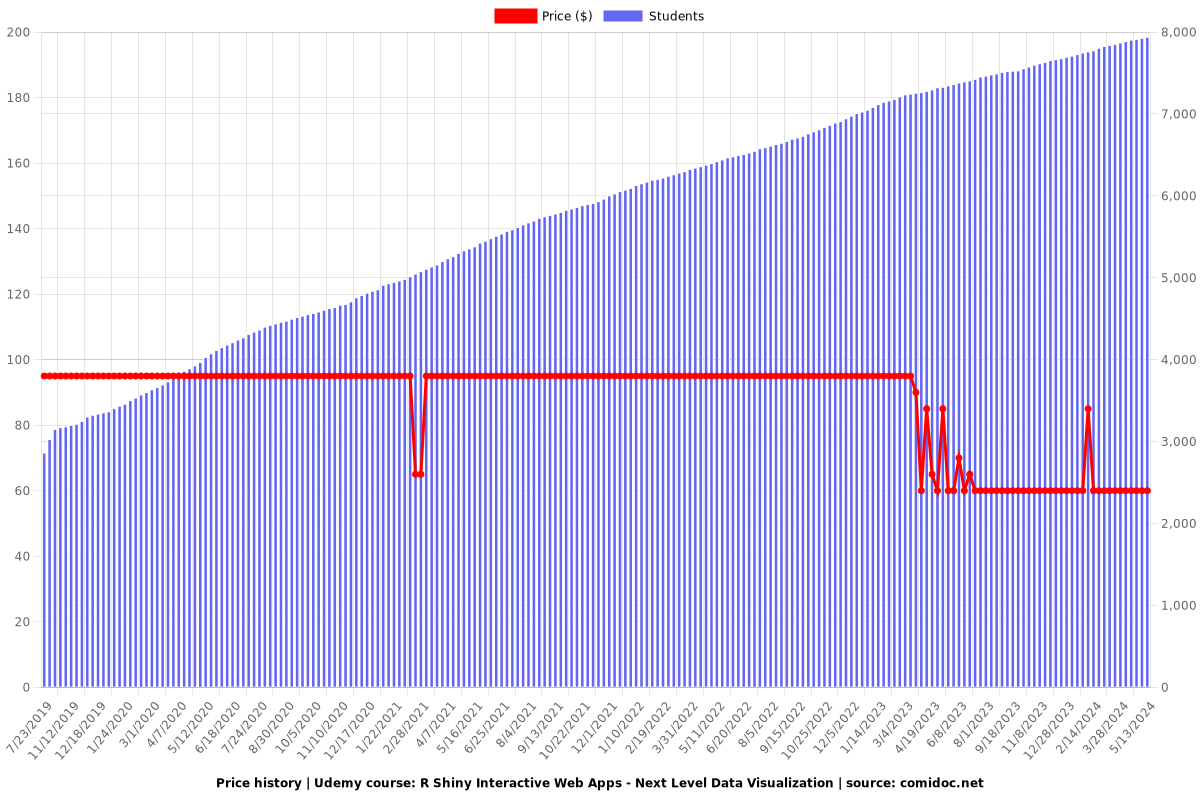
7,913
students
3 hours
content
Jul 2017
last update
$59.99
regular price
What you will learn
generate advanced shiny web apps
share apps over the internet or locally
embed pdfs, videos, images and text in a web app
create multi page shiny apps
add focus and zooming tools to shiny apps
generate shiny apps based on data tables
use pre defined layouts for styling
generate downloadable tables
Why take this course?
🚀 **Course Title:** R Shiny Interactive Web Apps - Next Level Data Visualization 📊✨
---
### Course Headline:
**Unlock the Power of Data with R Shiny - Master Interactive Visualizations and Share Them Online!**
---
### Course Description:
Are you ready to transform the way you present data? With our "R Shiny Interactive Web Apps" course, you'll dive into the world of interactive data visualization using R and Shiny. This comprehensive training is designed to help you create dynamic, user-friendly web applications that allow users to engage with your data in a meaningful way. 🖥️💻
---
**Why Master R Shiny?**
R Shiny apps are the future of data storytelling. They enable users to:
- **Interact:** Set filters, choose columns in tables, and generate parameters for plots with ease.
- **Explore:** Zoom into specific areas of plots, and focus on selected portions of your data.
- **Input Data:** Users can provide or upload files, text, and various types of data without needing R knowledge.
- **Customize:** Tailor the app to your users' preferences for a seamless experience.
---
### Course Structure:
**Getting Started with R Shiny:**
We'll begin by exploring the anatomy of a Shiny app and understanding the structure of a typical Shiny script. 🏗️
---
**Making Your App Interactive:**
Learn how to enhance your apps with input widgets, which allow users to interact with the app content based on their inputs. 🖱️
---
**Designing an Appealing Layout:**
Discover the secrets to styling your Shiny app for a professional and user-friendly interface. ✨
---
**Embedding Web Content:**
Integrate multimedia content such as YouTube videos, PDFs, text, and images within your Shiny apps using HTML tags. 🎬📑
---
**Advanced Interactive Features:**
Explore advanced features like zooming capabilities and the ability to download data or plots from your app. 🔍📊
---
**Integrating Tables:**
Learn how to seamlessly incorporate tables into your Shiny apps, enhancing the user experience with more complex data interaction. 🗣️📈
---
**Practical Application with a Real-World Project:**
Apply all the concepts learned in this course by working on a comprehensive project that mirrors a real-world financial app. You'll receive the project description and raw data to put your skills to the test! 🏦💸
---
**Prerequisites:**
This course assumes you have basic knowledge of R. If you're new to R, we recommend completing an introductory R course beforehand. 📚
---
**Tools and Resources:**
We'll guide you through obtaining all the necessary software, additional R packages, and free hosting solutions for your Shiny apps. 🛠️
---
**Join the Shiny Community:**
Imagine the impact you could make with an interactive web app that tells your data's story in a compelling way. R Shiny is not just a tool; it's a communication revolution. 🚀
---
### Enroll Now and Start Your Journey to Data Visualization Mastery! 🌟
---
*Note: This course is designed for individuals with basic R proficiency. If you are starting from scratch, please acquire foundational R skills before diving into this course.*
Our review
---
**Overall Course Rating:** 4.46
**Recent Reviews Summary:**
**Pros:**
- **Well-Structured Content:** The course is praised for its well-organized structure and easy-to-find code snippets, which are beneficial for building Shiny apps. (Review 1)
- **Clear Explanations:** The instructor's explanations are described as clear, engaging, and the course delivers content with clarity. (Review 2 & Review 7)
- **Real-World Application:** The course is recommended for those looking to add Shiny to their R skill set for work projects, making learners feel confident in using Shiny subsequently. (Review 3 & Review 6)
- **Useful Content:** The content provided is appreciated for helping learners understand the components needed to create a shiny dashboard and is considered useful overall. (Review 4 & Review 8)
- **Anticipation of Updated Versions:** Learners are looking forward to updated versions of the course with new features of R Shiny covered. (Review 9 & Review 12)
- **Basic R Skill Set:** The course is deemed very good for beginners who have a basic knowledge of R. (Review 10)
- **Complementary to Existing Resources:** Although some content is available on the R Shiny website, the course serves as a nice refresher and covers topics that online resources might not explain in detail. (Review 13 & Review 14)
- **Good for New Shiny Users:** The course is seen as an introduction to Shiny, though some feel it's more for those who are not completely new to Shiny. (Review 15 & Review 16)
- **Engaging and Valuable:** The course is considered engaging, with a good project at the end to test skills and ensure concept understanding. (Review 17 & Review 18)
- **Clear and Perfect Pace:** The instructor's pace is praised for being perfect, and the expectations are laid out clearly. (Review 19)
**Cons:**
- **Lack of Response Interaction:** A noticeable drawback is the lack of responses to questions posed by learners, resulting in a large number of unanswered questions. (Review 2)
- **Need for More Section Projects:** Some reviewers suggest that additional section projects leading up to the final project would enhance the learning experience. (Review 5)
- **Subtitle Errors and Missing Transcripts:** A few learners point out errors in the subtitles, which are generated by machine, and the absence of transcripts hinders their learning process. (Review 10 & Review 11)
- **Outdated Content:** The course material is noted as potentially outdated, with some learners suggesting that a refresh to cover recent developments in R Shiny would be beneficial. (Review 6 & Review 12)
- **Superficial Depth:** The course is described as "quick and dirty," covering only the essentials without deep dives into specific functions or their relationships, which some learners prefer for a more engaging experience. (Review 14)
- **Insufficient Line-by-Line Coding Explanations:** A few reviewers express that they wished for a line-by-line coding approach with explanations as the instructor coded, rather than reviewing completed scripts afterward. (Review 15)
- **Lack of Complex Dashboard Explanations:** Some learners suggest that more detailed step-by-step explanations on why certain functions or code are chosen for complex dashboards would be helpful. (Review 18)
- **Expectation Misalignment:** The course is indicated to be for individuals with solid knowledge in R and ggplot2, which may not align with learners who are new to R or seeking a more foundational course. (Review 17)
**Recommendations for Improvement:**
- **Update Content Regularly:** Ensure that the course content includes the latest features and updates in R Shiny.
- **Provide More Practical Examples:** Introduce more detailed section projects to guide learners through more complex aspects of Shiny app development.
- **Improve Subtitle Accuracy:** Correct machine-generated subtitles and provide accurate transcripts for better learning aid.
- **Engage with Learners:** Address learner questions by providing responses to foster interaction and deepen understanding.
- **Enhance Coding Tutorials:** Offer more in-depth line-by-line coding explanations and discussions on function choices and their implications.
**Conclusion:**
The course is generally well-received for its structured content, clear explanations, and real-world applicability, but it could benefit from regular updates, additional practical examples, improved subtitle accuracy, more engagement with learners, and enhanced coding tutorials to address the cons and improve learner experience.
Charts
Price
Rating
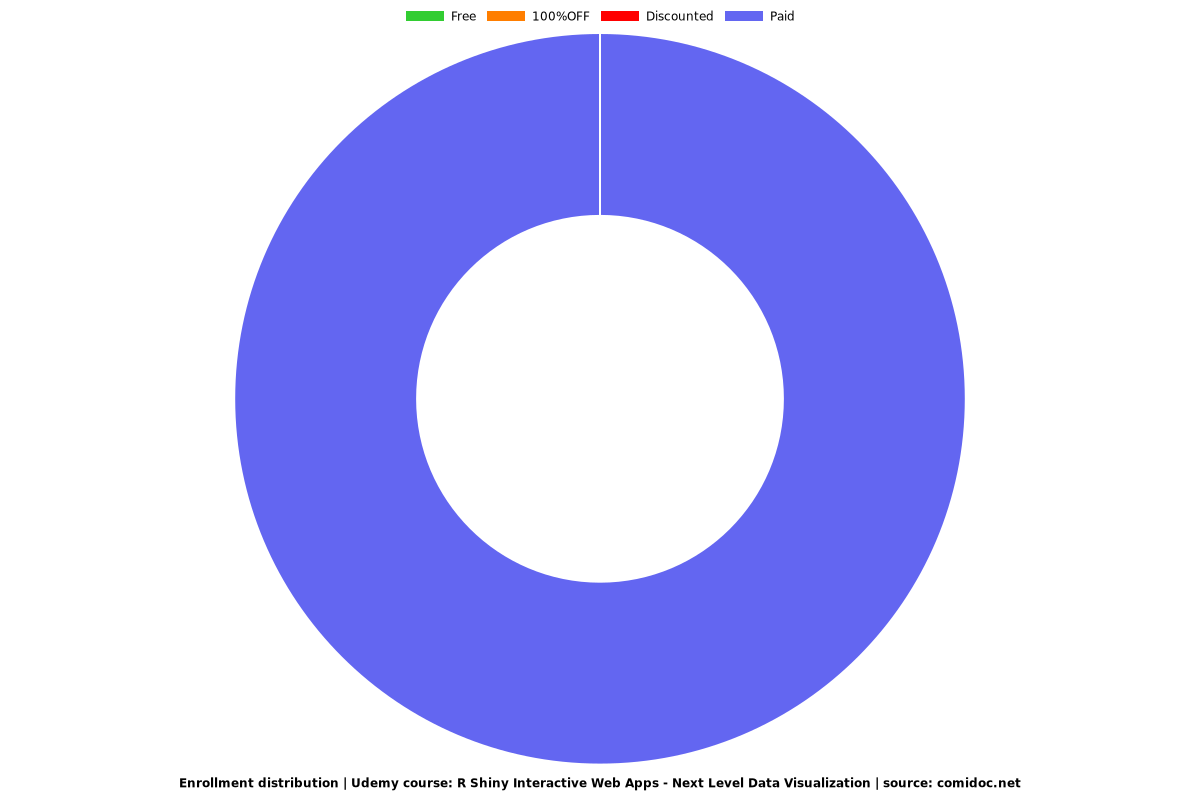
Enrollment distribution
Related Topics
1019008
udemy ID
11/21/2016
course created date
7/23/2019
course indexed date
Bot
course submited by