R Programming
R for Data Science

What you will learn
You will learn the most important tools in R that will allow you to do data science
You will learn to install R studio
You will have the tools to tackle a wide variety of data science challenges, using the best parts of R.
You will learn to import your data into R
You will learn how to Tidy the data. Tidying your data means storing it in consistent form that matches the semantics of the dataset with the way it is stored.
You will learn Visualisation, A good visualisation will show you things that you did not expect, or raise new questions about the data
You will learn Models, they are complementary tools to visualisation.
Once you have made your questions sufficiently precise, you can use a model to answer them. Models are a fundamentally mathematical or computational tool.
Why take this course?
Data science is an exciting discipline that allows you to turn raw data into understanding, insight, and knowledge. The goal of “R for Data Science” is to help you learn the most important tools in R that will allow you to do data science. After going through this course, you’ll have the tools to tackle a wide variety of data science challenges, using the best parts of R.
What you will learn
Data science is a huge field, and there’s no way you can master it by going through a single course. The goal of this course is to give you a solid foundation in the most important tools
First, you must import your data into R. This typically means that you take data stored in a file, database, or web API, and load it into a data frame in R. If you can’t get your data into R, you can’t do data science on it!
Once you’ve imported your data, it is a good idea to tidy it. Tidying your data means storing it in a consistent form that matches the semantics of the dataset with the way it is stored. In brief, when your data is tidy, each column is a variable, and each row is an observation. Tidy data is important because the consistent structure lets you focus your struggle on questions about the data, not fighting to get the data into the right form for different functions.
Once you have tidy data, a common first step is to transform it. Transformation includes narrowing in on observations of interest (like all people in one city, or all data from the last year), creating new variables that are functions of existing variables (like computing speed from distance and time), and calculating a set of summary statistics (like counts or means). Together, tidying and transforming are called wrangling, because getting your data in a form that’s natural to work with often feels like a fight!
Once you have tidy data with the variables you need, there are two main engines of knowledge generation: visualization and modelling. These have complementary strengths and weaknesses so any real analysis will iterate between them many times.
Prerequisites:
You should be generally numerically literate, and it’s helpful if you have some programming experience already.
Testimonials:
i really need this type of teaching style..this is superb ~ Nitish kumar giri
It dives right into advanced R concepts related to Data Science ~ Rainer Rodrigues
I am into revision .. its good. ~ Jagannath Chaudhary
Honestly it's a good match for me and I'm hoping to know more ~ Salim Adams
It was a good experience. Find it really helpful. ~ Shafia Amin
Its is really helpful for R programming building. ~ Muhammad Nazim
class was really informative and got new learning experience. ~ Gayathry Harilal
Reviews
Charts
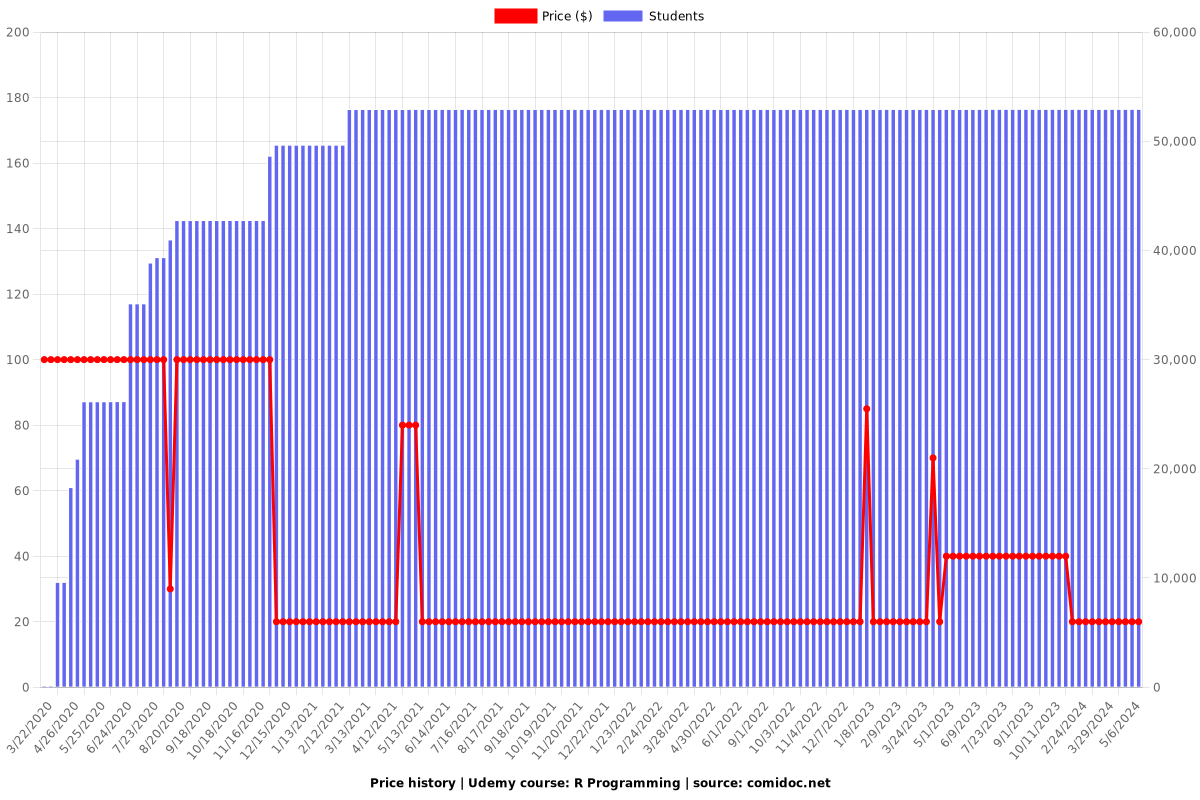
Price
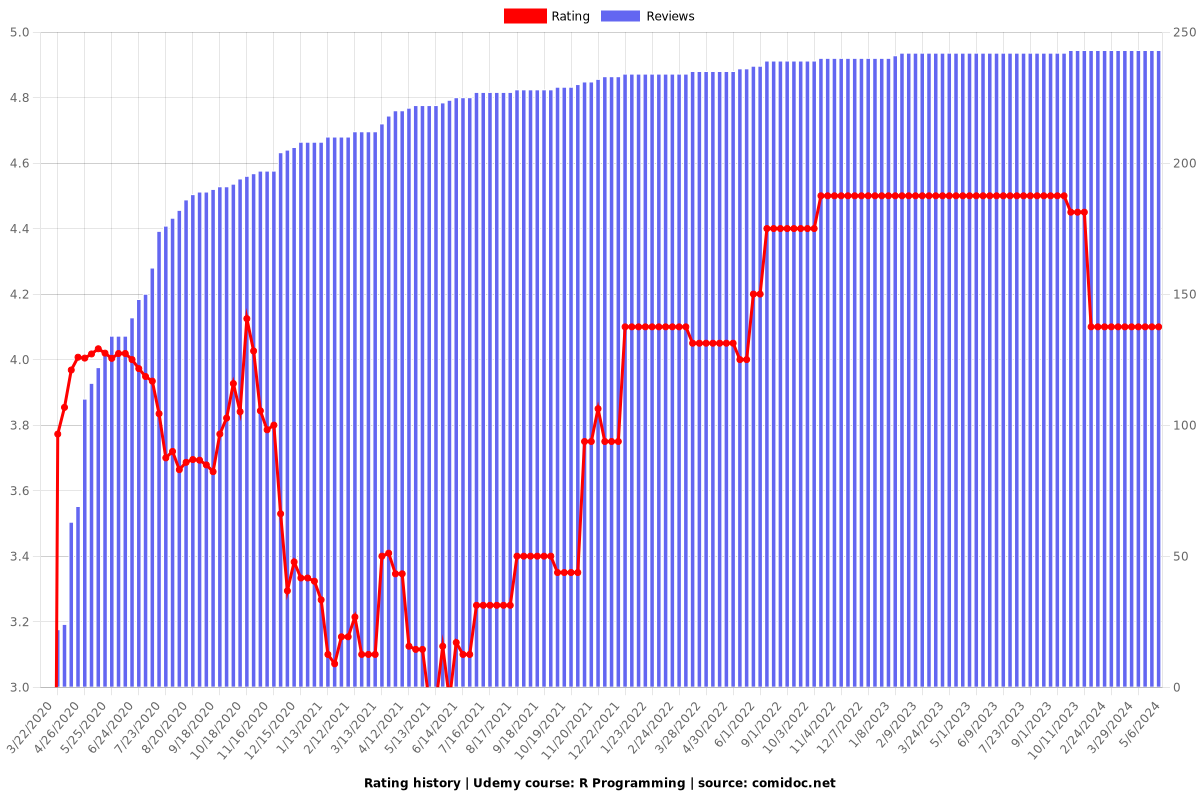
Rating
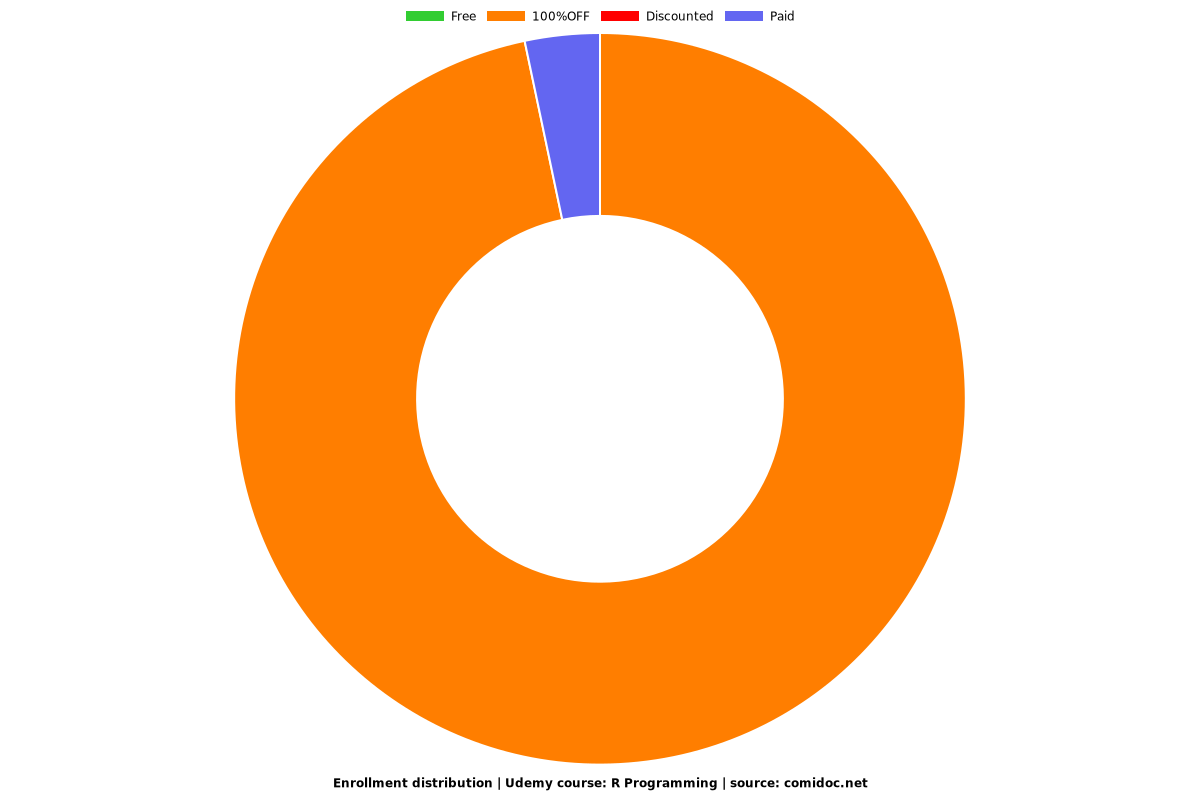
Enrollment distribution