Quantitative - Financial Statement Analysis
Detailed financial analysis, financial models, financial ratios, graphs, FSA part-2

What you will learn
Become industry ready for premium finance roles
Build a solid foundation of financial analysis concepts including building financial models
Analyse financials of real companies in this course
Learn financial ratios and their interpretation
Learn to comprehensively analyse company’s financials in details
Multiple practice exercises with solutions, as well as quizzes
Suitable for students, aspiring equity research and credit analysts
Become a successful financial analyst in no time
Make investing decisions
Useful for finance & banking roles dealing with credit and credit risk
Primer to fundamental analysis useful in company valuations
Extensively using Microsoft excel, all files are downloadable
10 hours of video content and much more
Pre-requisite: Accounting Basics
Why take this course?
Do you want to become industry ready for a premium finance role? If yes, then this course is for you.
This course prepares you for industries and work profiles like investment banking, equity research, credit analysis, corporate finance, private equity. All these roles require financial statement analysis as a core skillset.
This course is part-2 of the Financial Statement Analysis (FSA) series that focuses on analysing financials of companies in detail. We cover in detail the profit and loss statements, balance sheets, notes to accounts, and annual reports. Over and above the traditional and proven methods of financial analysis, this course employs newer methods to draw insights about a company’s business and performance.
The course takes a comprehensive approach and covers building numerous financial models on MS Excel including calculating financial ratios, drawing graphs, identifying patterns, structure and financial risk. There are numerous quizzes and practice exercises for learners to master these techniques.
The course is fully hands-on and practical, it covers financial analysis of real companies. It is suited for students and professionals intending to learn and master financial analysis.
This course is self-sufficient and can be undertaken independent of part-1 of FSA series – as it covers all concepts in details.
Downloadable excel files are available as part of practice exercises (don't miss them). Full instructor support is provided.
Watch the preview video to know more, and looking forward to see you soon.
Screenshots


Reviews
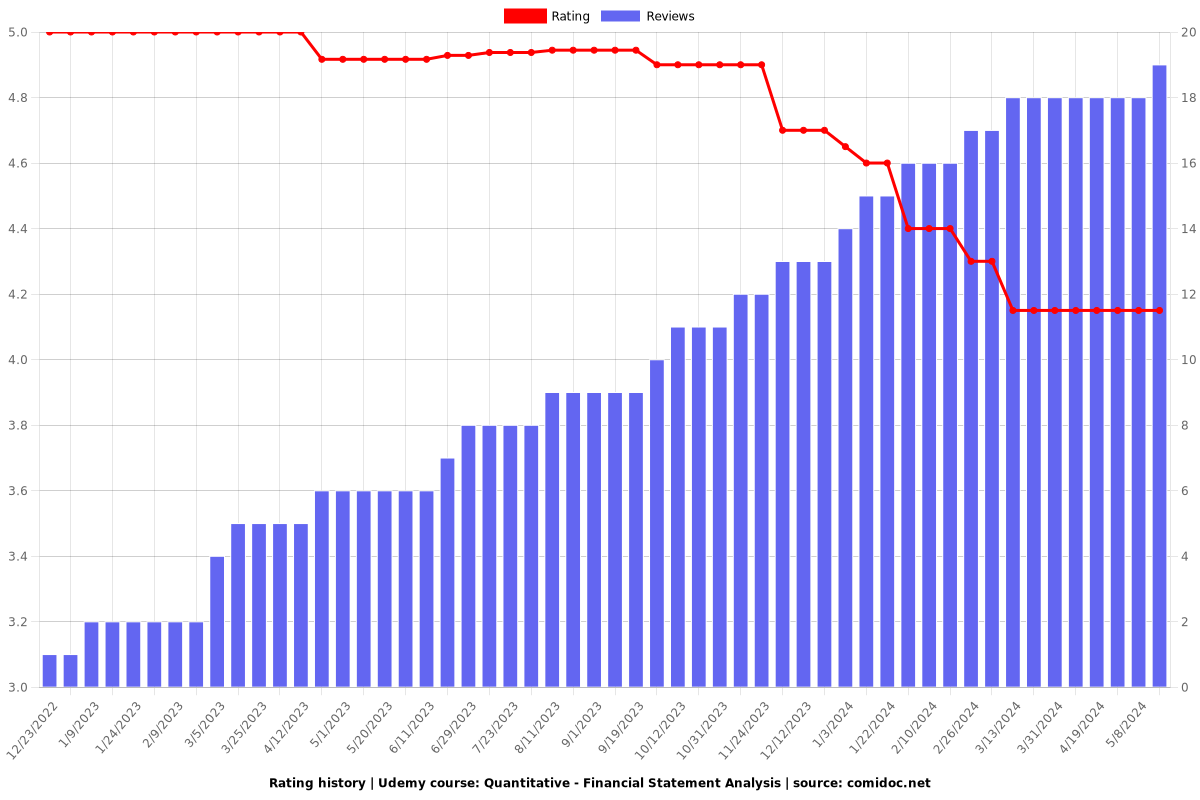
Charts
Price

Rating
Enrollment distribution