Python Data Science basics with Numpy, Pandas and Matplotlib
Covers all Essential Python topics and Libraries for Data Science or Machine Learning Beginner.

What you will learn
Essential Python data types and data structure basics with Libraries like NumPy and Pandas for Data Science or Machine Learning Beginner.
Why take this course?
Welcome to my new course Python Essentials with Pandas and Numpy for Data Science
In this course, we will learn the basics of Python Data Structures and the most important Data Science libraries like NumPy and Pandas with step by step examples!
The first session will be a theory session in which, we will have an introduction to python, its applications and the libraries.
In the next session, we will proceed with installing python in your computer. We will install and configure anaconda which is a platform you can use for quick and easy installation of python and its libraries. We will get ourselves familiar with Jupiter notebook, which is the IDE that we are using throughout this course for python coding.
Then we will go ahead with the basic python data types like strings, numbers and its operations. We will deal with different types of ways to assign and access strings, string slicing, replacement, concatenation, formatting and f strings.
Dealing with numbers, we will discuss the assignment, accessing and different operations with integers and floats. The operations include basic ones and also advanced ones like exponents. Also we will check the order of operations, increments and decrements, rounding values and type casting.
Then we will proceed with basic data structures in python like Lists tuples and set. For lists, we will try different assignment, access and slicing options. Along with popular list methods, we will also see list extension, removal, reversing, sorting, min and max, existence check , list looping, slicing, and also inter-conversion of list and strings.
For Tuples also we will do the assignment and access options and the proceed with different options with set in python.
After that, we will deal with python dictionaries. Different assignment and access methods. Value update and delete methods and also looping through the values in the dictionary.
And after learning all of these basic data types and data structures, its time for us to proceed with the popular libraries for data-science in python. We will start with the NumPy library. We will check different ways to create a new NumPy array, reshaping , transforming list to arrays, zero arrays and one arrays, different array operations, array indexing, slicing, copying. we will also deal with creating and reshaping multi dimensional NumPy arrays, array transpose, and statistical operations like mean variance etc using NumPy
Later we will go ahead with the next popular python library called Pandas. At first we will deal with the one dimensional labelled array in pandas called as the series. We will create assign and access the series using different methods.
Then will go ahead with the Pandas Data frames, which is a 2-dimensional labelled data structure with columns of potentially different types. We will convert NumPy arrays and also pandas series to data frames. We will try column wise and row wise access options, dropping rows and columns, getting the summary of data frames with methods like min, max etc. Also we will convert a python dictionary into a pandas data frame. In large datasets, its common to have empty or missing data. We will see how we can manage missing data within dataframes. We will see sorting and indexing operations for data frames.
Most times, external data will be coming in either a CSV file or a JSON file. We will check how we can import CSV and JSON file data as a dataframe so that we can do the operations and later convert this data frame to either CSV and json objects and write it into the respective files.
Also we will see how we can concatenate, join and merge two pandas data frames. Then we will deal with data stacking and pivoting using the data frame and also to deal with duplicate values within the data-frame and to remove them selectively.
We can group data within a data-frame using group by methods for pandas data frame. We will check the steps we need to follow for grouping. Similarly we can do aggregation of data in the data-frame using different methods available and also using custom functions. We will also see other grouping techniques like Binning and bucketing based on data in the data-frame
At times we may need to use custom indexing for our dataframe. We will see methods to re-index rows and columns of a dataframe and also rename column indexes and rows. We will also check methods to do collective replacement of values in a dataframe and also to find the count of all or unique values in a dataframe.
Then we will proceed with implementing random permutation using both the NumPy and Pandas library and the steps to follow. Since an excelsheet and a dataframe are similar 2d arrays, we will see how we can load values in a dataframe from an excelsheet by parsing it. Then we will do condition based selection of values in a dataframe, also by using lambda functions and also finding rank based on columns.
Then we will go ahead with cross Tabulation of our dataframe using contingency tables. The steps we need to proceed with to create the cross tabulation contingency table.
After all these operations in the data we have, now its time to visualize the data. We will do exercises in which we can generate graphs and plots. We will be using another popular python library called Matplotlib to generate graphs and plots. We will do tweaking of the grpahs and plots by adjusting the plot types, its parameters, labels, titles etc.
Then we will use another visualization option called histogram which can be used to groups numbers into ranges. We will also be trying different options provided by matplotlib library for histogram
Overall this course is a perfect starter pack for your long journey ahead with big data and machine learning. You will also be getting an experience certificate after the completion of the course(only if your learning platform supports)
So lets start with the lessons. See you soon in the class room.
Screenshots


Our review
Charts
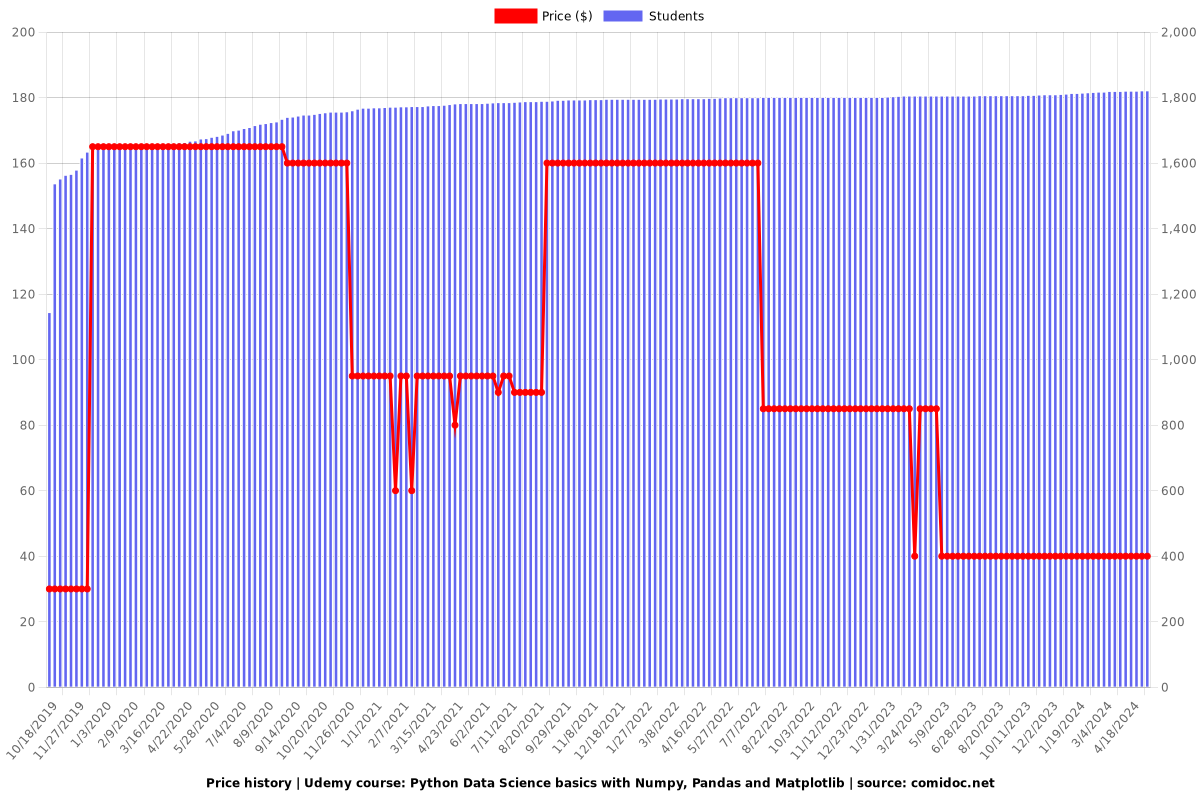
Price
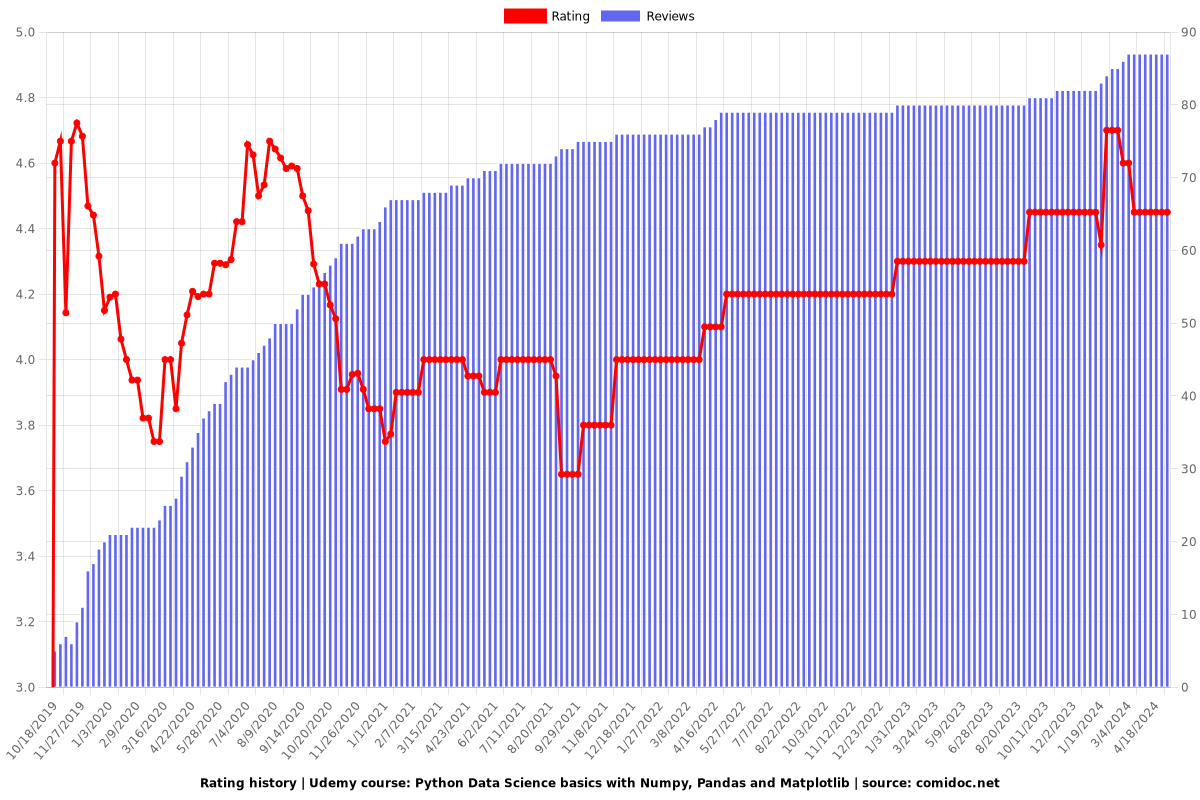
Rating
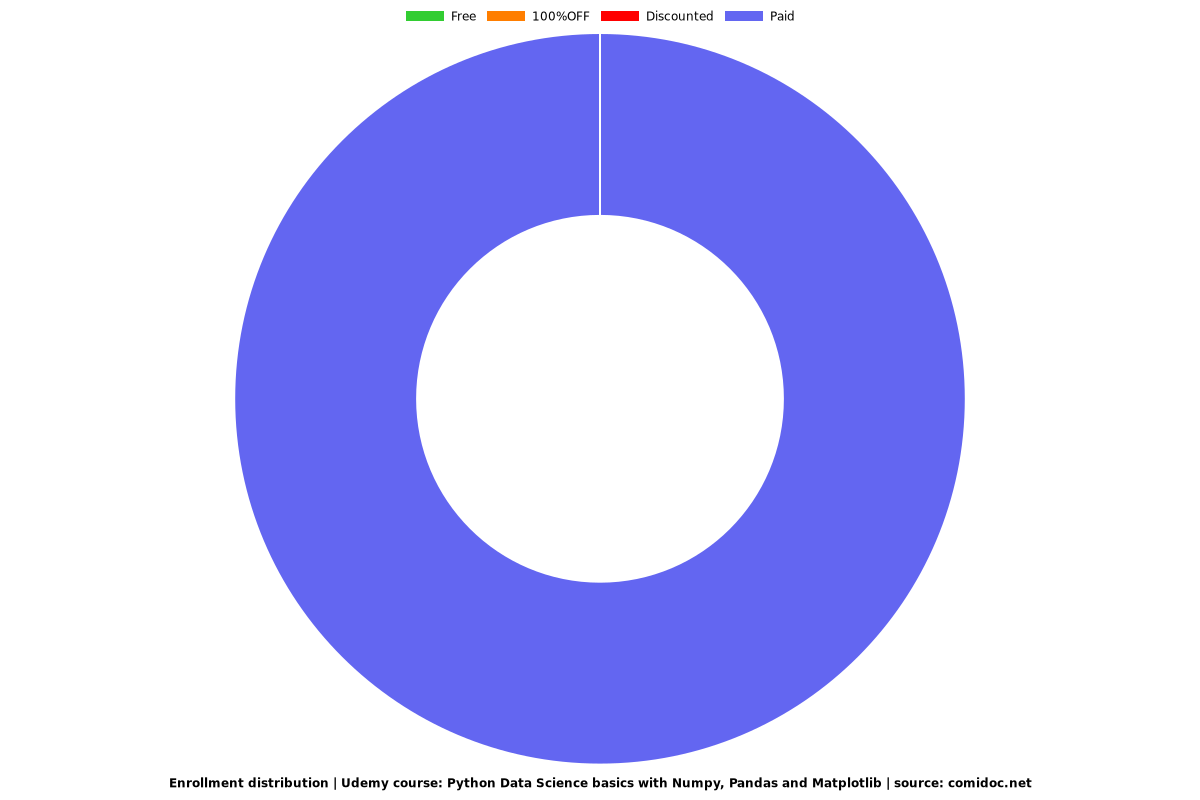
Enrollment distribution