Practice Exams | Microsoft PL-300: Power BI Data Analyst
Be prepared for the Microsoft PL-300: Power BI Data Analyst certification

What you will learn
Exam PL-300: Microsoft Power BI Data Analyst
Get data from data sources
Clean the data
Transform and load the data
Design and implement a data model
Create model calculations by using DAX
Optimize model performance
Visualize and analyze the data
Enhance reports for usability and storytelling
Identify patterns and trends
Create and manage workspaces and assets
Manage datasets
Why take this course?
In order to set realistic expectations, please note: These questions are NOT official questions that you will find on the official exam. These questions DO cover all the material outlined in the knowledge sections below. Many of the questions are based on fictitious scenarios which have questions posed within them.
The official knowledge requirements for the exam are reviewed routinely to ensure that the content has the latest requirements incorporated in the practice questions. Updates to content are often made without prior notification and are subject to change at any time.
Each question has a detailed explanation and links to reference materials to support the answers which ensures accuracy of the problem solutions.
The questions will be shuffled each time you repeat the tests so you will need to know why an answer is correct, not just that the correct answer was item "B" last time you went through the test.
NOTE: This course should not be your only study material to prepare for the official exam. These practice tests are meant to supplement topic study material.
Should you encounter content which needs attention, please send a message with a screenshot of the content that needs attention and I will be reviewed promptly. Providing the test and question number do not identify questions as the questions rotate each time they are run. The question numbers are different for everyone.
As a candidate for this exam, you should deliver actionable insights by working with available data and applying domain expertise. You should:
Provide meaningful business value through easy-to-comprehend data visualizations.
Enable others to perform self-service analytics.
Deploy and configure solutions for consumption.
As a Power BI data analyst, you work closely with business stakeholders to identify business requirements. You collaborate with enterprise data analysts and data engineers to identify and acquire data. You use Power BI to:
Transform the data.
Create data models.
Visualize data.
Share assets.
You should be proficient at using Power Query and writing expressions by using Data Analysis Expressions (DAX). You know how to assess data quality. Plus, you understand data security, including row-level security and data sensitivity.
Skills at a glance
Prepare the data (25–30%)
Model the data (25–30%)
Visualize and analyze the data (25–30%)
Deploy and maintain items (15–20%)
Prepare the data (25–30%)
Get data from data sources
Identify and connect to a data source
Change data source settings, including credentials, privacy levels, and data source locations
Select a shared semantic model, or create a local data model
Choose between DirectQuery, Import, and Dual mode
Change the value in a parameter
Clean the data
Evaluate data, including data statistics and column properties
Resolve inconsistencies, unexpected or null values, and data quality issues
Resolve data import errors
Transform and load the data
Select appropriate column data types
Create and transform columns
Transform a query
Design a star schema that contains facts and dimensions
Identify when to use reference or duplicate queries and the resulting impact
Merge and append queries
Identify and create appropriate keys for relationships
Configure data loading for queries
Model the data (25–30%)
Design and implement a data model
Configure table and column properties
Implement role-playing dimensions
Define a relationship's cardinality and cross-filter direction
Create a common date table
Implement row-level security roles
Create model calculations by using DAX
Create single aggregation measures
Use CALCULATE to manipulate filters
Implement time intelligence measures
Identify implicit measures and replace with explicit measures
Use basic statistical functions
Create semi-additive measures
Create a measure by using quick measures
Create calculated tables
Optimize model performance
Improve performance by identifying and removing unnecessary rows and columns
Identify poorly performing measures, relationships, and visuals by using Performance Analyzer
Improve performance by choosing optimal data types
Improve performance by summarizing data
Visualize and analyze the data (25–30%)
Create reports
Identify and implement appropriate visualizations
Format and configure visualizations
Use a custom visual
Apply and customize a theme
Configure conditional formatting
Apply slicing and filtering
Configure the report page
Use the Analyze in Excel feature
Choose when to use a paginated report
Enhance reports for usability and storytelling
Configure bookmarks
Create custom tooltips
Edit and configure interactions between visuals
Configure navigation for a report
Apply sorting
Configure sync slicers
Group and layer visuals by using the Selection pane
Drill down into data using interactive visuals
Configure export of report content, and perform an export
Design reports for mobile devices
Enable personalized visuals in a report
Design and configure Power BI reports for accessibility
Identify patterns and trends
Use the Analyze feature in Power BI
Use grouping, binning, and clustering
Incorporate the Q&A feature in a report
Use AI visuals
Use reference lines, error bars, and forecasting
Detect outliers and anomalies
Create and share scorecards and metrics
Deploy and maintain items (15–20%)
Create and manage workspaces and items
Create and configure a workspace
Assign workspace roles
Configure and update a workspace app
Publish, import, or update items in a workspace
Create dashboards
Choose a distribution method
Apply sensitivity labels to workspace content
Configure subscriptions and data alerts
Promote or certify Power BI content
Manage global options for files
Manage semantic models
Identify when a gateway is required
Configure a semantic model scheduled refresh
Configure row-level security group membership
Provide access to semantic models
Configure automatic page refresh
Screenshots


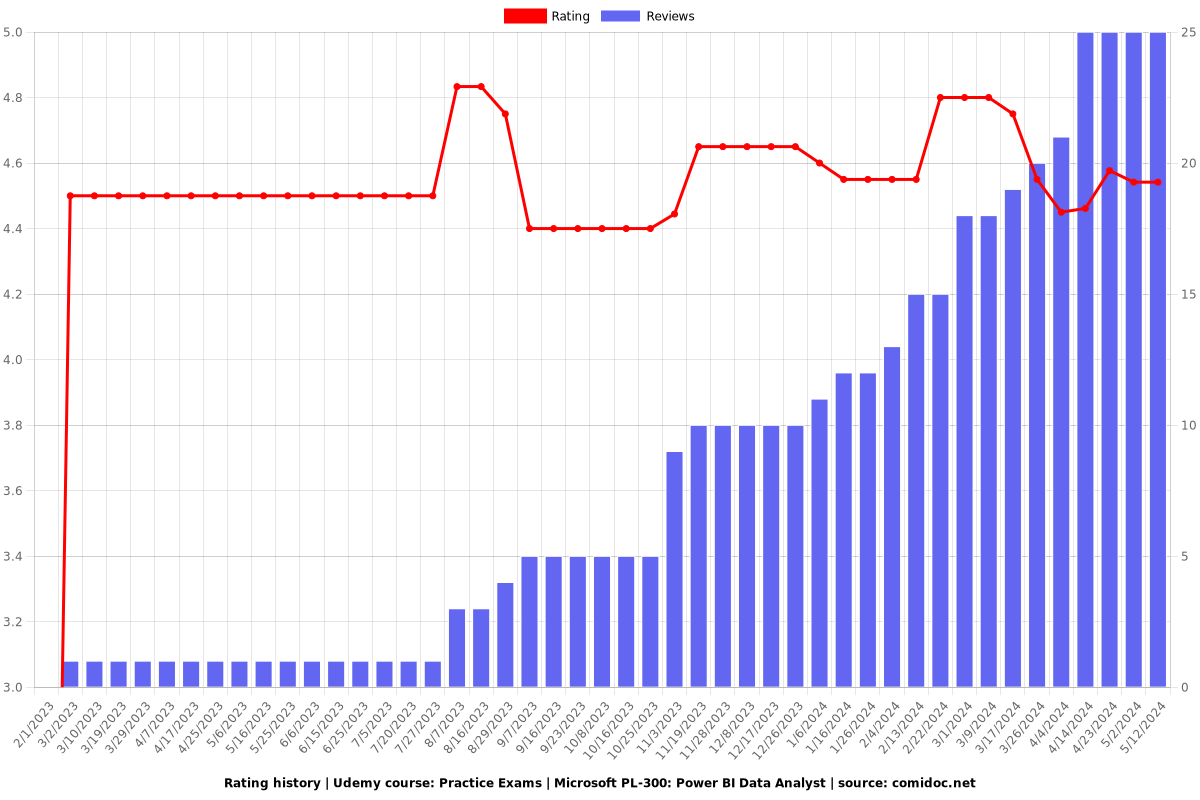
Reviews
Charts
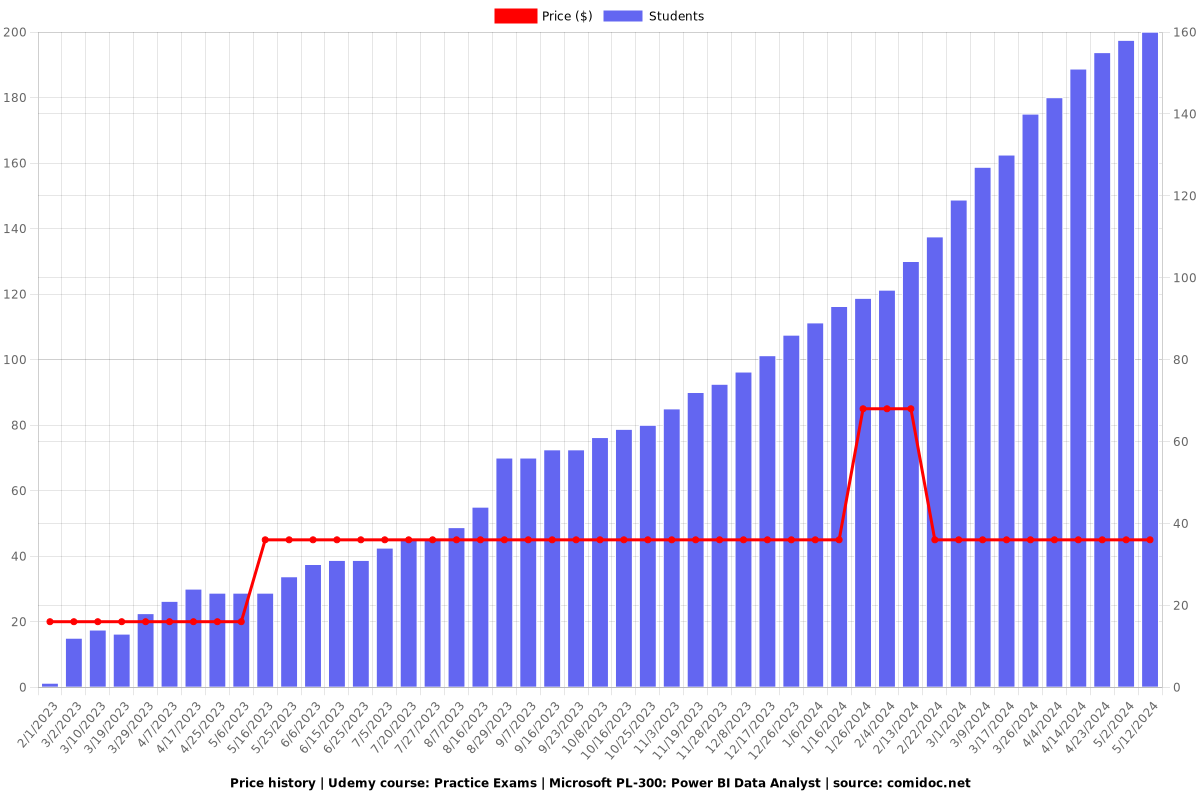
Price
Rating
Enrollment distribution