Data Science practical approach with Python
Prepare Data Analysis Examination with Pandas, Numpy, Matplotlib, sklearn, Python

What you will learn
Data Cleaning
Perform Large Data Analysis and Presentation
Manage, identify and predict project risk
Apply Linear Regression Model when analysing data
Why take this course?
Data analysis is an essential process in modern-day businesses that helps organizations make informed decisions. In this summary, we will use Python to analyze a dataset and present our findings. The dataset we will be exploring is the Titanic dataset which contains information about the passengers who were aboard the Titanic when it sank and the Wetland dataset which contains information about the climatical situation in a certain region. We will start by importing the necessary libraries and loading the dataset into a Pandas DataFrame.
This course seeks to ensure that the learners are able to use the available datasets to make predictions and decision making. This course has EDA Techniques that will help you master the Data Science project at University or college.
In this course, we shall cover multiple linear regression and other important libraries that can help us have a clear picture of what we need as our output. We shall be using Google Colab in this course but you are free to use any IDE of your choice.
ADVANTAGES OF DATA ANALYSIS AND OF THIS COURSE:
Data analysis is an essential process that helps organizations make informed decisions based on data. Data analysis allows organizations to identify trends, patterns, and insights that can be used to improve business operations, customer satisfaction, and profitability.
One of the critical advantages of data analysis is that it allows organizations to identify potential problems before they become significant issues. By analyzing data, organizations can identify areas where improvements can be made to reduce costs, improve productivity, or enhance customer satisfaction.
Data analysis also allows organizations to make informed decisions based on data-driven insights. For example, a business can use data analysis to identify customer preferences and tailor its products or services to meet those preferences. Similarly, data analysis can be used to identify market trends, which can be used to inform product development and marketing strategies.
Data analysis is also essential in industries such as healthcare and finance, where decisions can have life-changing consequences. In healthcare, data analysis can be used to identify trends in patient outcomes and develop treatment plans that are more effective. In finance, data analysis can be used to identify potential fraud or predict market trends, which can be used to make investment decisions.
In addition to providing insights and identifying trends, data analysis also plays a crucial role in measuring the success of business initiatives. By analyzing data, organizations can measure the effectiveness of their marketing campaigns, product launches, and other initiatives. This allows organizations to identify areas for improvement and adjust their strategies accordingly.
Data analysis is essential for any organization that wants to make informed decisions based on data-driven insights. Data analysis allows organizations to identify trends, patterns, and insights that can be used to improve business operations, customer satisfaction, and profitability. Additionally, data analysis is critical in industries such as healthcare and finance, where decisions can have life-changing consequences.
Screenshots


Charts
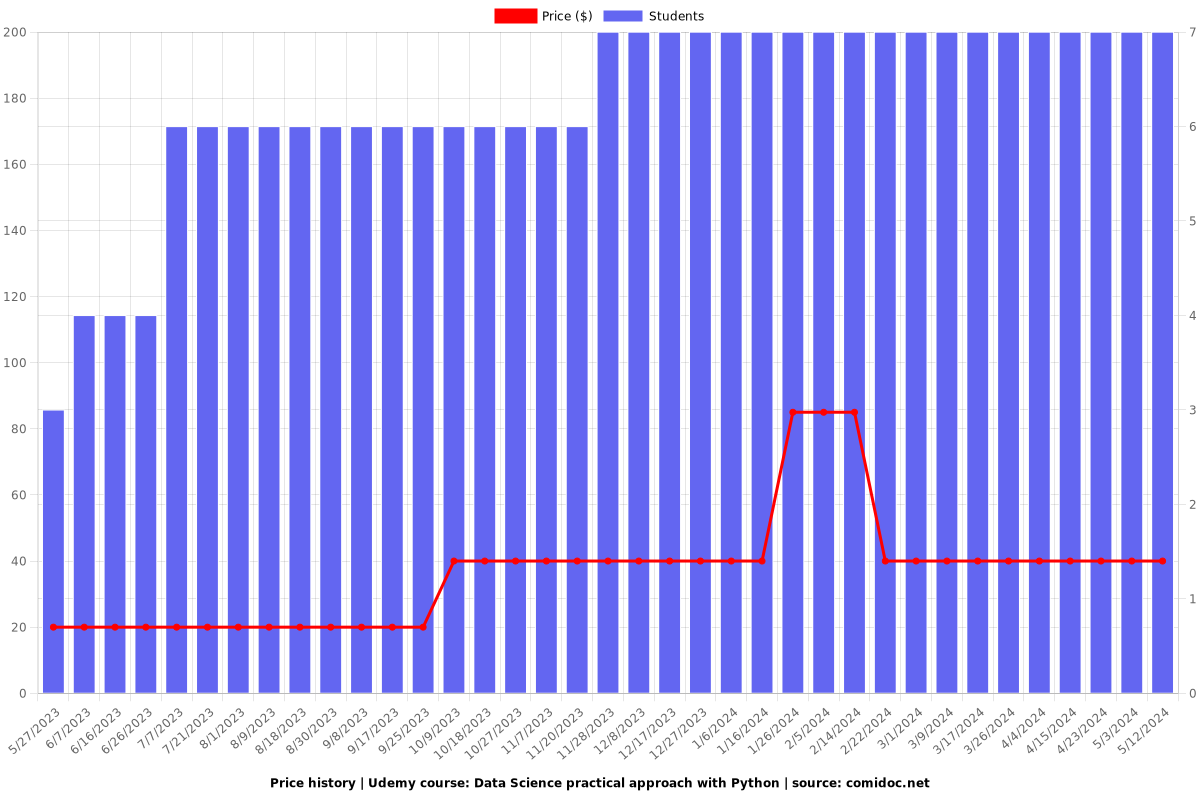
Price
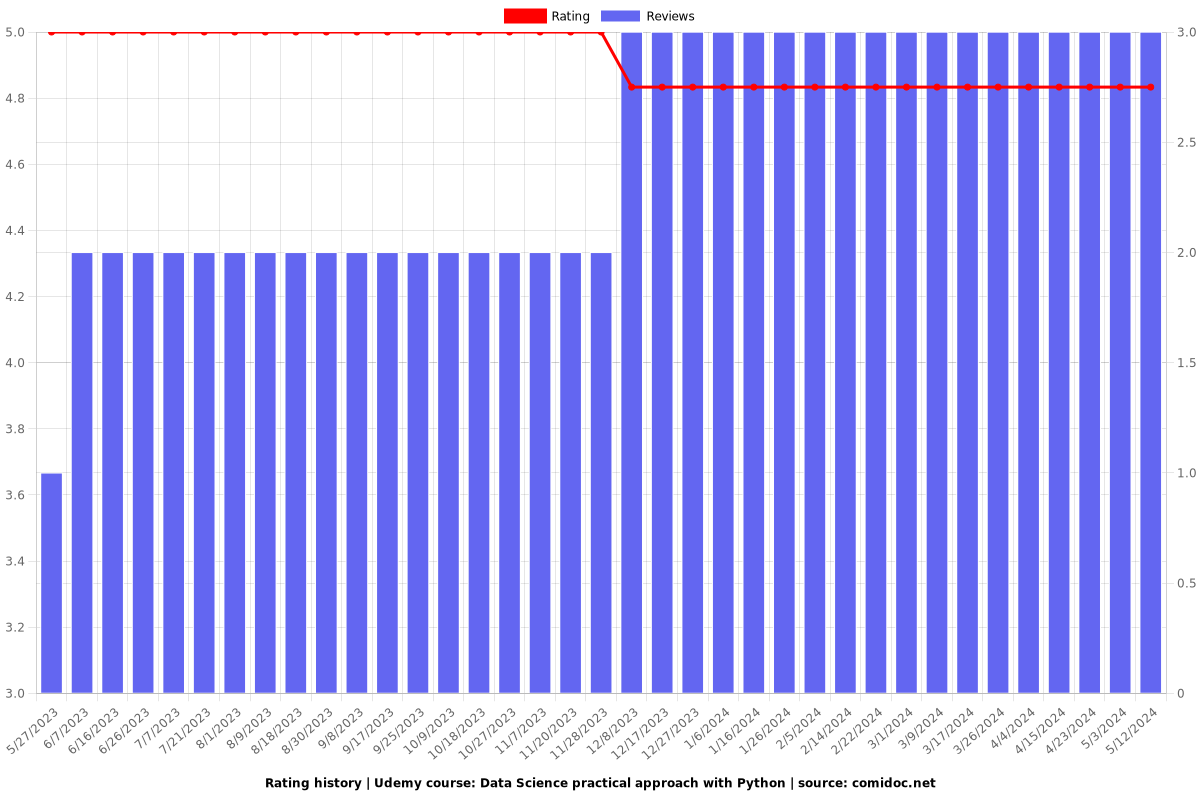
Rating
Enrollment distribution