Power BI Q&A Visual
Getting the most out of the amazing and artificial intelligence driven Power BI Q&A visual
3.17 (6 reviews)

45
students
1.5 hours
content
Apr 2020
last update
$19.99
regular price
What you will learn
How to get the most out of the powerful and surprisingly useful Power BI Q& visual
How to create questions that return the results your users want
How to gain insight into your data
How to teach or train the Q&A visual to understand custom terms and words
How to use synonyms to really ramp up the effectiveness of the Q&A visual
Practice exercises to sharpen your skills using real-world data
Why take this course?
The Q&A visual is both a tool to allow your report users to quickly get answers to their data, and by report designers to create visuals in their reports by simply double-clicking anywhere on a report and using natural language to get started asking questions of their data and generating an array of visuals. The Q&A visual behaves like any other visual meaning it can take advantage of cross-filtering/cross-highlighting and the use of bookmarks. I am confident you will be surprised and amazed at what this artificial intelligence tool can do for you and your users.
Screenshots


Reviews
Nadir
August 18, 2020
Not sure why this course is made. course begins with no introduction or anything. Slides are not even clearly visible. Highly unprofessional course
Frank
July 29, 2020
Topic is a good match but content and presentation is weak and not very professional. The trainer looks knowledgeable but the course feels like a YouTube video more than a paid course.
I finished all the lessons and I still think it is not prepared professionally. It feels like a bonus content rather than a real class.
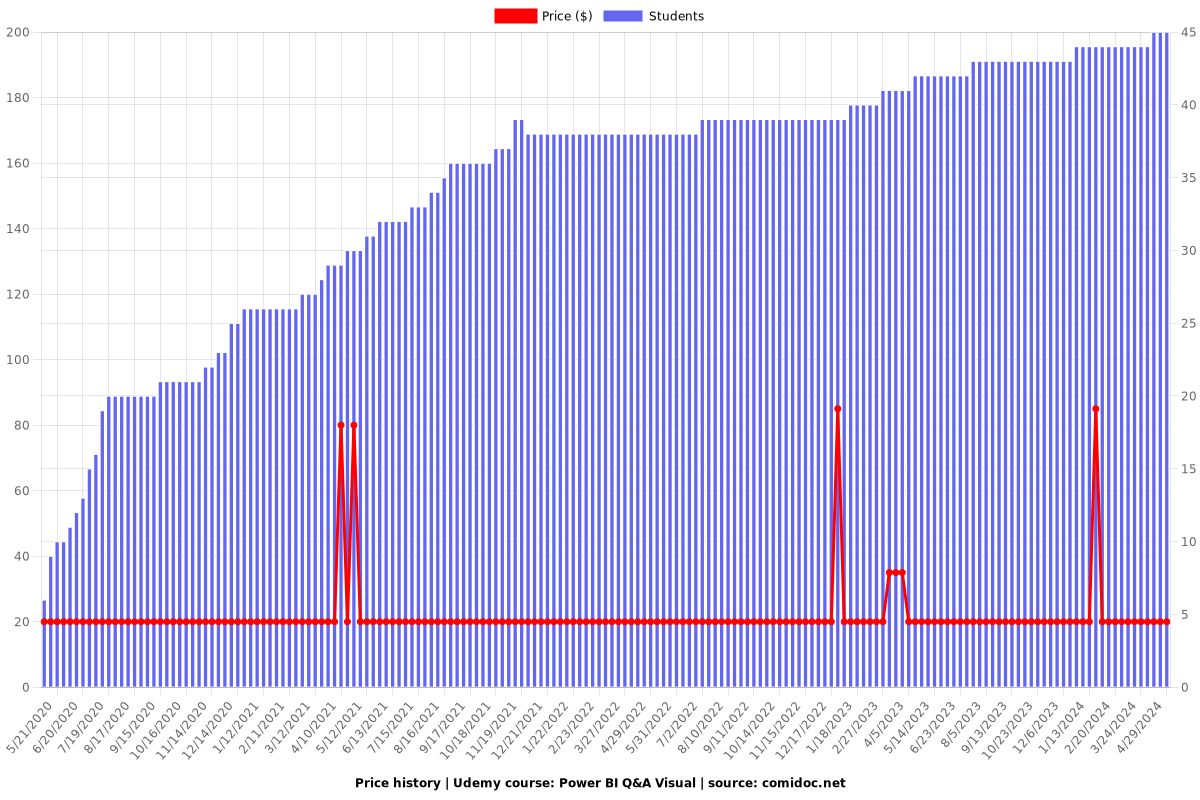
Charts
Price
Rating

Enrollment distribution

Related Topics
2976318
udemy ID
4/8/2020
course created date
5/21/2020
course indexed date
Bot
course submited by