Excel Advanced Dashboard Infographics MasterClass Volume 2
Learn the Art of converting your Dashboards and Charts into Creative,Innovative and Professional Looking Infographics

What you will learn
Taking this course will be the best decision you will make as you will not only take your MS Excel Skills to a different level but also you will be an expert in creating attention-grabbing MS Excel infographics that you can use in your next presentation, your website or your social media campaign or anywhere you want.
Why take this course?
Welcome to the next level of data visualization with Microsoft Excel! After the overwhelming success of my first course on Dashboard Infographics, I am thrilled to present to you Excel Advanced Dashboard Infographics MasterClass Volume 2. This advanced course is designed to elevate your dashboards from mere data displays to masterpieces that will captivate and engage your audience like never before.
Are you ready to unleash the power of Microsoft Excel and transform your data into beautiful, visual, and dynamic infographics? Are you eager to enhance your presentations, stand out in meetings, and showcase your data visualization skills in a way that garners appreciation and respect? If your answer is a resounding "Yes!" then this course is where you need to be!
🌟 Get ready for an exhilarating ride through the world of data visualization with our FAST-PACED, HIGH-VALUE COURSE that promises to equip you with the skills necessary to achieve these goals!
--- **What Are Infographics?** Infographics are more than just a fancy way to present data; they are graphic visual representations of information, data, or knowledge, designed to present information quickly and clearly. They are a powerful tool for storytelling with data. --- **Why Should You Create Infographics?** 🚀 **Grab Your Target Audience's Attention:** Infographics naturally attract attention, especially when they contain compelling facts, stats, data, and figures. They are the perfect medium to make your message stand out in a crowded digital space. 📊 **Trend and Pattern Analysis:** By utilizing graphics, you can significantly improve cognition and enhance the human visual system's ability to detect patterns and trends within complex data sets. 👩🏫 **Position Yourself As An Expert:** Creating animated infographics with charts, graphs, and other relevant information demonstrates an in-depth understanding of the subject matter. It showcases your ability to research thoroughly and present information that is both useful and visually appealing, thereby positioning you as an expert in your field. --- **What You Will Learn in This Course:** 🎓 **Advanced Excel Skills:** Master advanced Excel features and functions tailored for creating professional infographics. ✅ **Design Principles:** Understand the principles of design that make your infographics not only informative but also aesthetically pleasing. 🌈 **Data Visualization Techniques:** Learn various techniques to represent data effectively, ensuring your audience can easily comprehend and digest complex information. 🎨 **Infographic Creation Best Practices:** Discover the best practices for designing infographics that will make your data sing and your story tell itself. 📈 **Real-World Application:** Put your newfound skills to the test with real-world exercises designed to help you create captivating infographics for various industries and applications. --- Enroll now and join a community of learners who are ready to transform their data into stories that matter. With the Excel Advanced Dashboard Infographics MasterClass Volume 2, you're not just learning—you're unlocking a world of visual storytelling possibilities! 🎓✨ Don't miss out on this opportunity to elevate your skills and stand out in the professional world. Let's embark on this journey together and make every number tell its own story through stunning infographics created with Excel!Our review
Charts
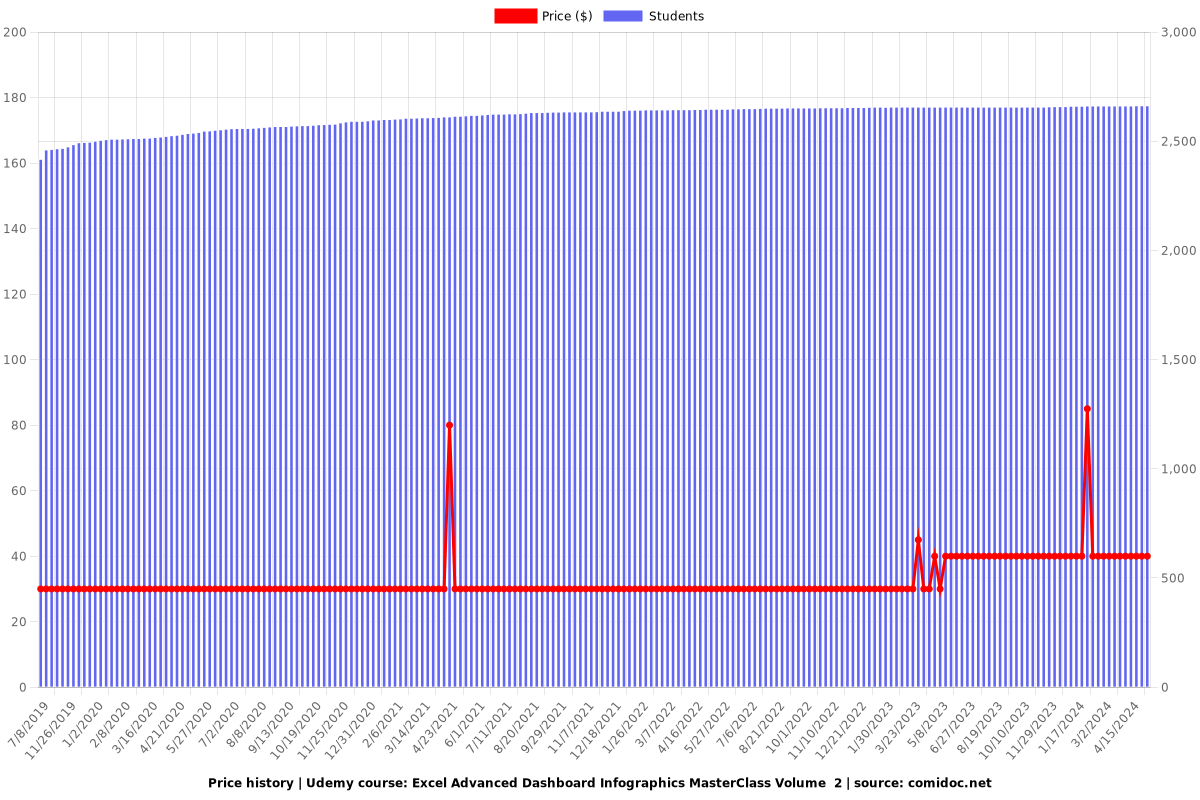
Price
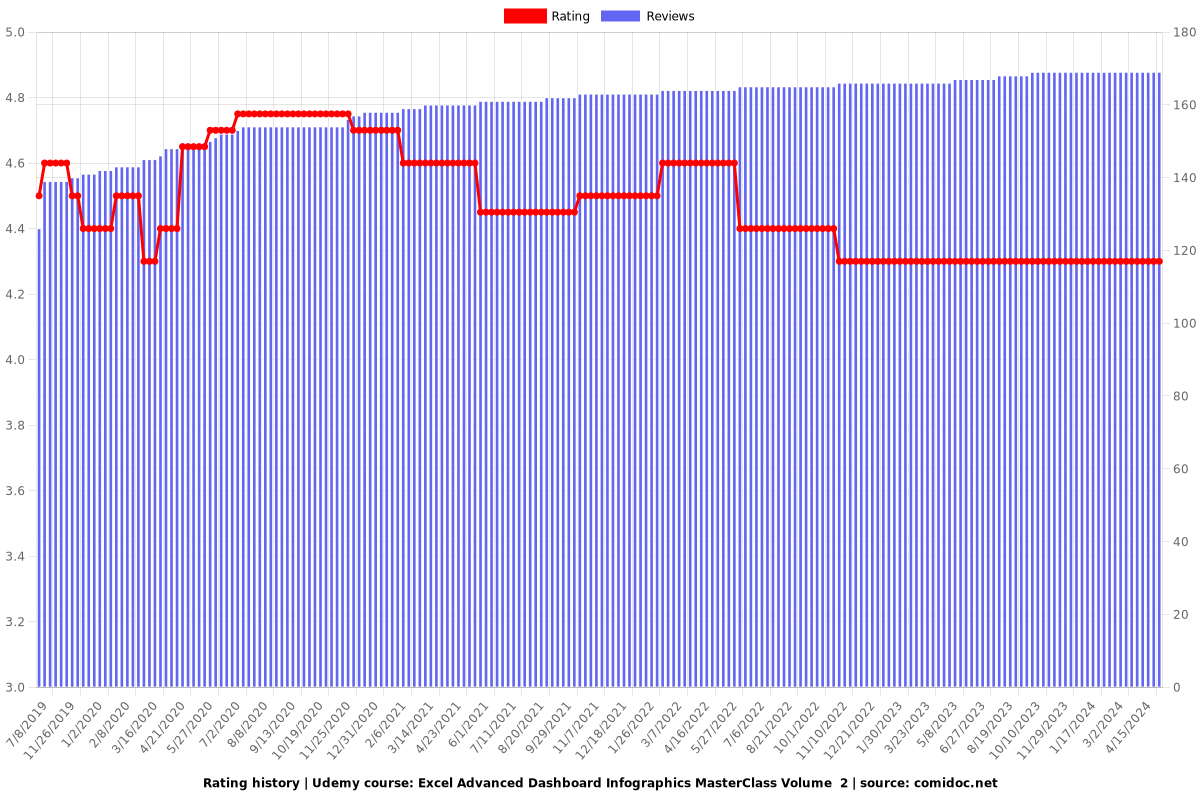
Rating
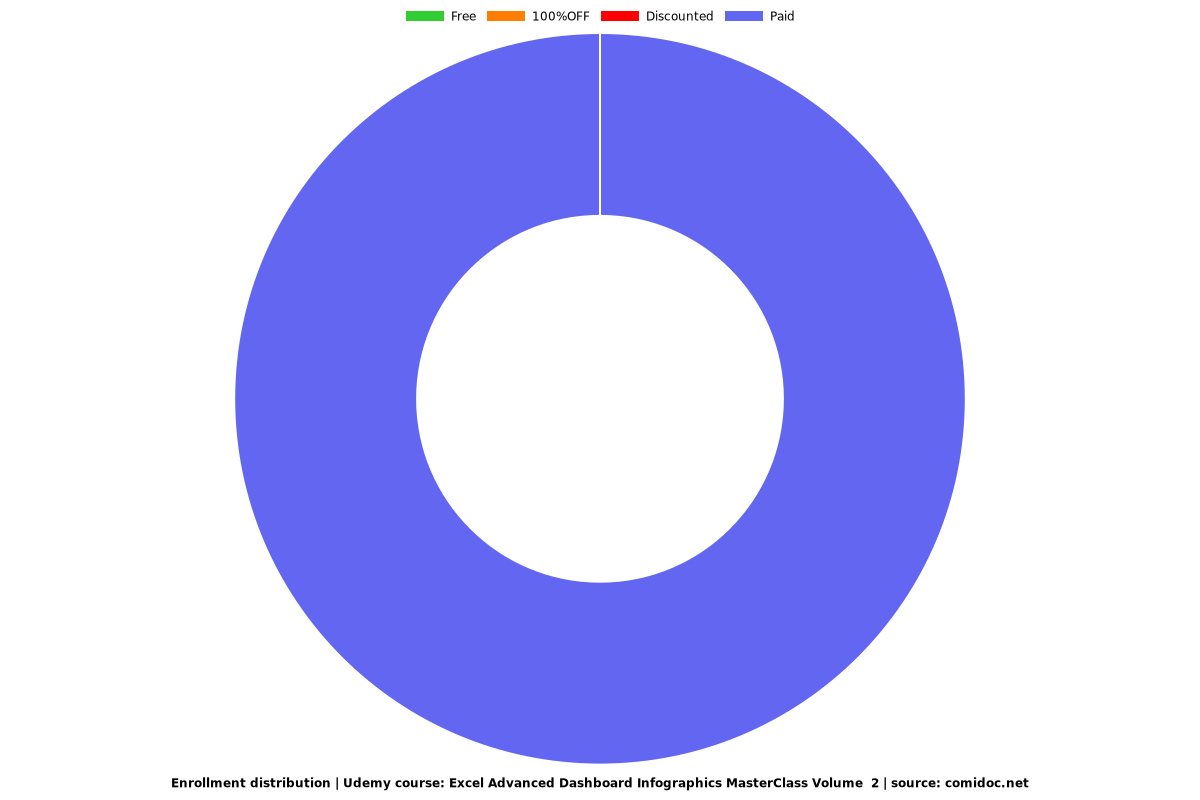
Enrollment distribution