How to manage your process using statistical Excel Tools

How to become a professional data analyst in quality assurance

4.67 (6 reviews)
Udemy
platform
English
language
Operations
category
How to manage your process using statistical Excel Tools
2,116
students
2 hours
content
Jun 2021
last update
$19.99
regular price

What you will learn

Quality control and production management using Excel & Statistical Analysis and Processes.

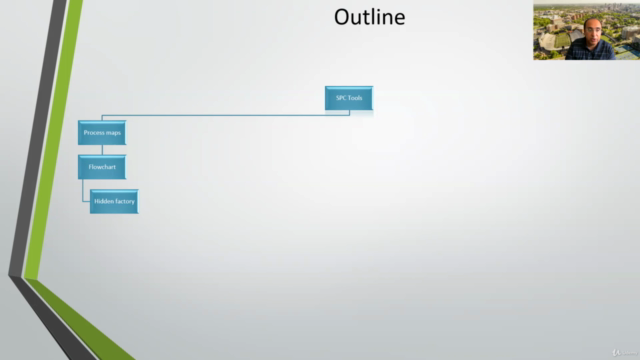
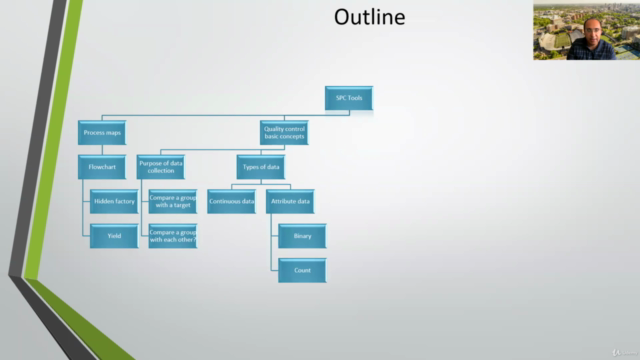
Process Maps/ Statistical Process Charts

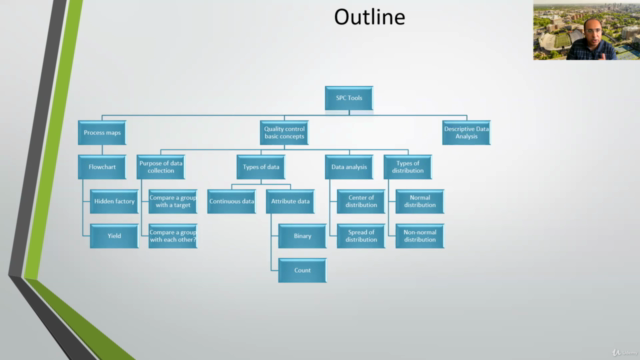
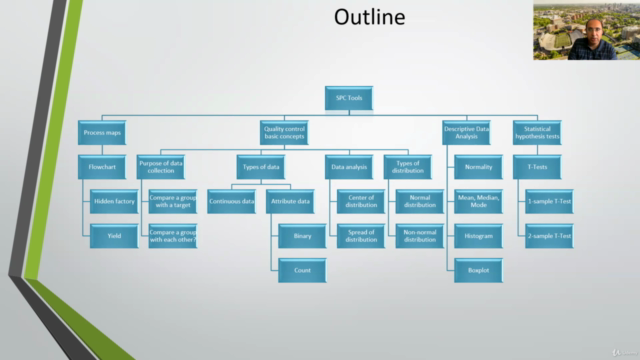
Basic statistical analysis

Hypothesis testing

Why take this course?

This course will provide hands on expertise to understand and undertake the following tasks using Excel. Both Powerpoint slides and excel data analysis are provided in this course. First we will understand the process maps, the purpose of analysis in process maps, and why yield calculations are crucial to understand where rework and scrap is being created. We will then review the basic statistical concepts and use Excel with samples to create histogram boxplot, calculate average and standard deviation. We will understand the types of data. We will undertake the basic hypothesis tests such as T-Test using and Excel add-on for Data Analysis Tool Pak. We will also understand what are the types of process charts and how to create the charts in Excel using formulas or using templates. This course will make you a skilled quality personnel and also help you to manage any process in a better way.

•SPC Tools

•Process maps : •Flowchart

•Hidden factory

•Yield calculation - IPY and RTY

•Quality control basic concepts

•Purpose of data collection: •Compare a group with a target or •Compare a group with each other?

•Types of data: •Continuous data •Attribute data •Binary •Count

•Data analysis: •Center of distribution •Spread of distribution

•Types of distribution: •Normal distribution •Non-normal distribution

•Descriptive Data Analysis: •Normality •Mean, Median, Mode

•Histogram

•Boxplot

•Statistical hypothesis tests

•T-Tests

•1-sample T-Test

•2-sample T-Test

•Statistical charts: •I-MR Chart •X-Bar Chart

Screenshots

How to manage your process using statistical Excel Tools - Screenshot_01How to manage your process using statistical Excel Tools - Screenshot_02How to manage your process using statistical Excel Tools - Screenshot_03How to manage your process using statistical Excel Tools - Screenshot_04

Charts

Price

How to manage your process using statistical Excel Tools - Price chart

Rating

How to manage your process using statistical Excel Tools - Ratings chart

Enrollment distribution

How to manage your process using statistical Excel Tools - Distribution chart
4148498
udemy ID
6/27/2021
course created date
6/30/2021
course indexed date
Bot
course submited by