Google Data Studio (Looker): Beginner's Crash Course 2023
Mastering Google Data Studio (Looker): Create Compelling Visualizations for Data-Driven Decisions

What you will learn
Understand the key features and benefits of Google Data Studio and how it can be used to create compelling visualizations from a variety of data sources.
Connect data sources to Google Data Studio (Looker) and troubleshoot common connection issues.
Create reports and dashboards in Google Data Studio (Looker) using best practices for design and interactivity.
Customize charts and graphs in Google Data Studio (Looker) using best practices for visual design and community-created tools and templates.
Apply advanced techniques and best practices for data visualization and storytelling in Google Data Studio (Looker).
Why take this course?
This course is a beginner's crash course on Google Data Studio (Looker) for 2023. Google Data Studio (Looker) is a powerful tool that allows users to create visual reports and dashboards from a variety of data sources. In this course, you will learn the basics of Google Data Studio (Looker), including how to connect your data sources, create charts and graphs, and customize your reports.
The course is divided into five modules that cover the following topics:
Module 1: Introduction to Google Data Studio (Looker)
What is Google Data Studio (Looker)?
Key features and benefits of Google Data Studio (Looker)
Data sources supported by Google Data Studio (Looker)
Module 2: Connecting Data Sources
How to connect your data sources to Google Data Studio (Looker)
Best practices for connecting data sources
Troubleshooting common connection issues
Module 3: Creating Reports and Dashboards
How to create reports and dashboards in Google Data Studio (Looker)
Best practices for report and dashboard design
Adding interactive features to your reports and dashboards
Module 4: Customizing Visualizations
How to customize charts and graphs in Google Data Studio (Looker)
Best practices for visual design
Creating custom visualizations using community-created tools and templates
Module 5: Advanced Techniques and Tips
Advanced techniques for using Google Data Studio (Looker)
Best practices for data visualization and storytelling
Tips for troubleshooting common issues
By the end of this course, you will have the skills necessary to create compelling visualizations to help you make better data-driven decisions.
Screenshots


Charts
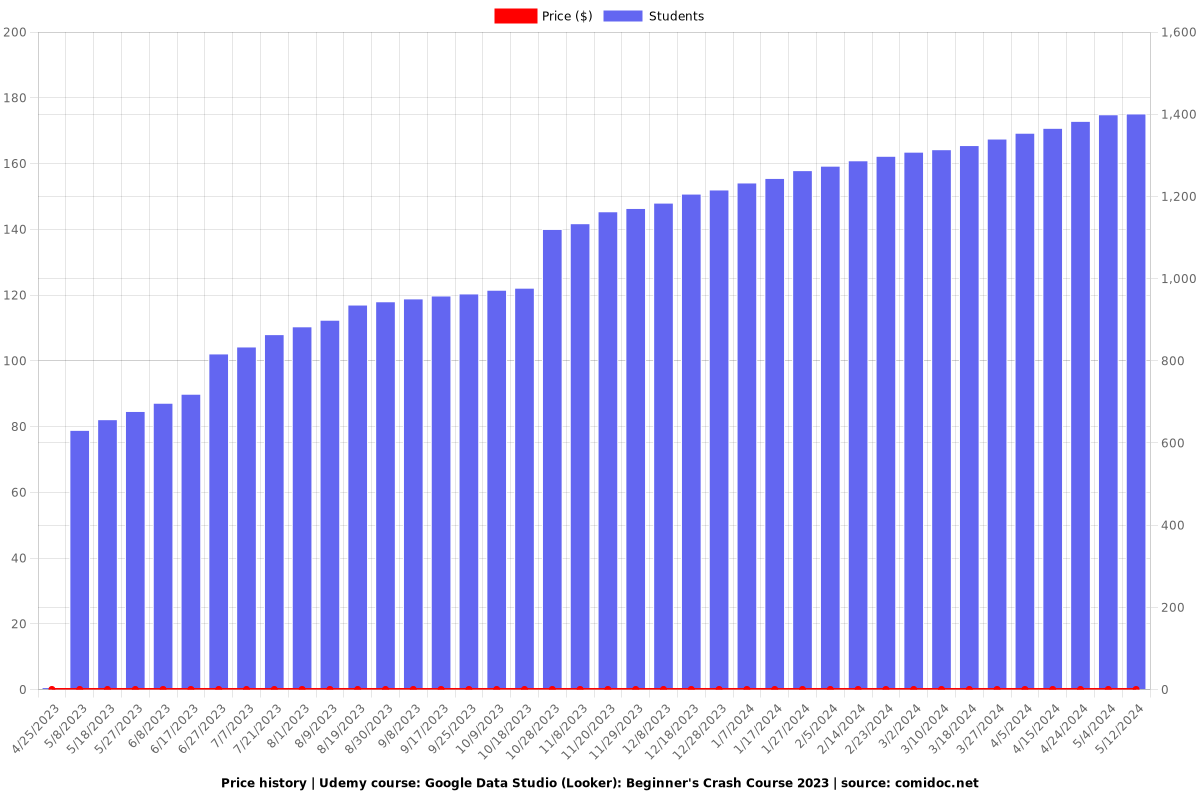
Price
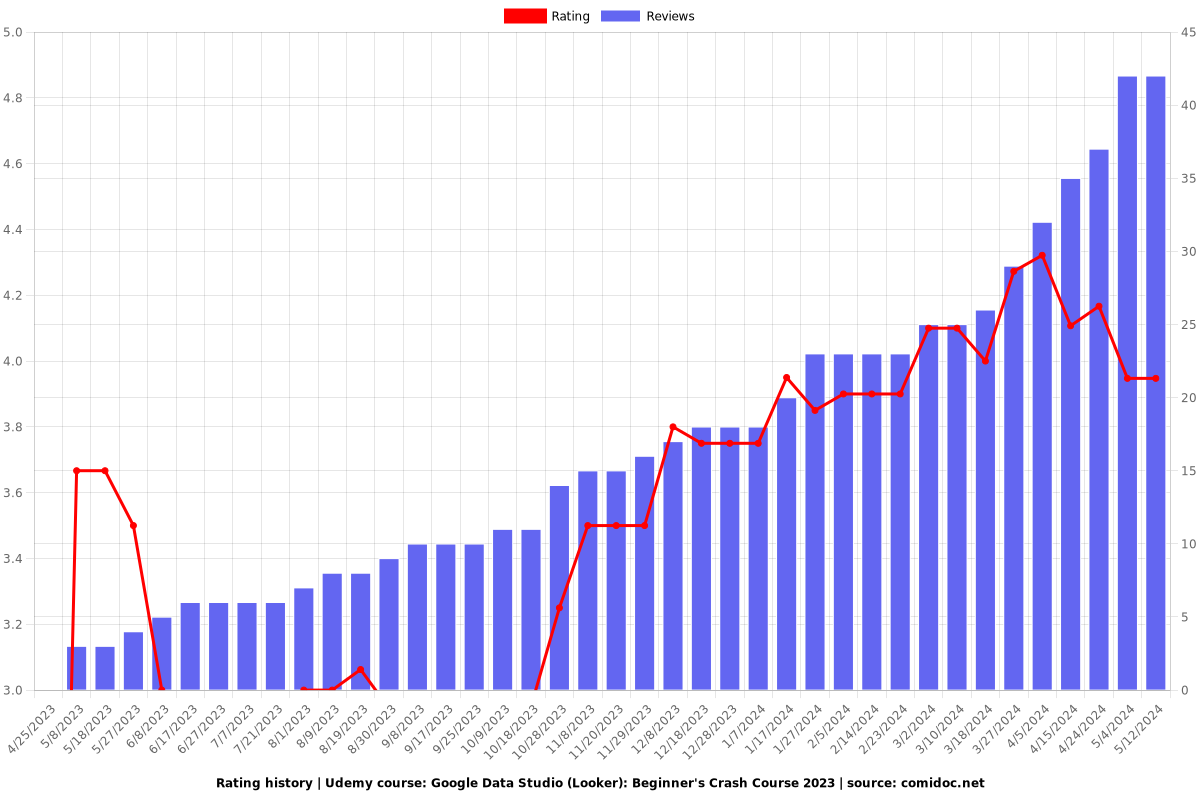
Rating
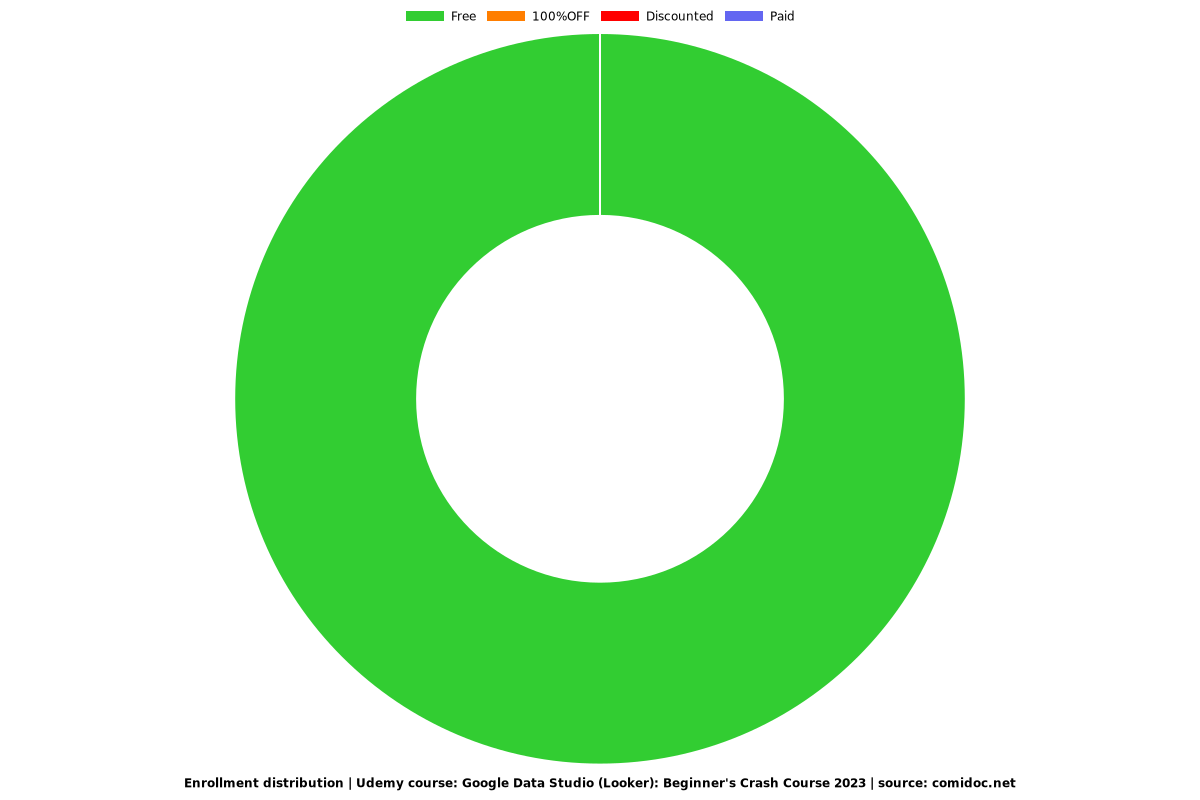
Enrollment distribution