Title
Google Data Studio A-Z: Looker Studio for Data Visualization
Use Google Data Studio (now Looker Studio) to create reports & visualizations from Google Sheets| Google Analytics

What you will learn
How to use Google Data Studio to turns your data into fully customizable informative reports and dashboards that are easy to read and share
All chart types that one can draw in Google Data Studio
Sharing and collaborating on Data studio reports
Branding a report - Adding Logo and setting theme
Embedding external content into the report
Embedding your Google Datastudio report on your website
Adding date range and filter controls to your dashboard
Why take this course?
🌟 Google Data Studio A-Z: Master Data Visualization with Looker Studio 🌟
[April 2024 update]
- 📈 Updated Course Content: The course now includes an updated definition of Dimensions and Measures as per the latest changes, detailed information on data blending with various types of joins supported by Looker Studio, and a refined approach to handling time series data.
🌍 6 Reasons to Choose This Google Data Studio Course 📚
- 🚀 Carefully Designed Curriculum: Master not just basic chart creation in Google Data Studio but also advanced features that set it apart from other data visualization tools.
- ⏱️ Concise Learning Experience: Complete this comprehensive course within one weekend, without sacrificing depth or understanding.
- 🏢 Real-World Examples and Case Studies: Learn with business scenarios that apply directly to your professional environment.
- 🤝 Practice Makes Perfect: Engage in ample practice exercises to solidify your data visualization skills.
- 📚 Downloadable Resources: Access valuable materials to enhance your learning journey outside of the course platform.
- 💬 Direct Instructor Support: Have your questions answered by the instructors themselves, ensuring no concept is left behind.
🏫 Course Overview 🎓
- Introduction to Google Data Studio (Looker Studio): Understand the platform's capabilities and its importance in data visualization.
- All Charts and Tables: Explore every type of chart and table available, from basic to complex, ensuring you can represent any dataset effectively.
- Data Filtering: Learn to create interactive reports with filtering options, allowing users to customize their view of the data.
- Branding Your Reports: Discover how to make your reports reflect your brand identity through logos and colors.
- Embedding External Content: Integrate external content such as videos, quizzes, or websites into your reports for a more comprehensive presentation.
- Data Blending: Combine data from multiple sources to create comprehensive visualizations that tell the full story of your data.
- Report Sharing and Collaboration: Share your insights with a wide audience and collaborate with your team in real-time.
🤝 Instructor Led, Real-World Skills 🌟
- The course is designed by industry veterans with extensive corporate experience, ensuring the skills you learn are directly applicable to today's business challenges.
💰 Google Data Studio: Free for All 💻
- Google Data Studio is offered completely free by Google, providing you with a powerful tool to visualize your data without any upfront investment.
🤔 Frequently Asked Questions (FAQs) 🤷♂️
- What can you do with Google Data Studio?
- Turn analytics data into clear and understandable reports.
- Create highly configurable charts, tables, and more for effective data representation.
- Share insights easily with your team or the public.
- Collaborate on reports within your team and streamline the report creation process using built-in sample reports.
🎓 Enroll Now and Transform Your Data Visualization Skills 🎯 Ready to become a Google Data Studio expert and visualize your data with confidence? Click the enroll button today and join us in lesson 1 of this transformative Google Data Studio course!
Start-Tech Academy - Empowering Data Visuals Since [Insert Year] 📈🚀
Enroll now and embark on a journey to become a pro at Google Data Studio! 🎉
Our review
🏫 Course Review: Google Data Studio Fundamentals
Overview
The course on Google Data Studio Fundamentals has received an overall rating of 4.55 from recent reviewers. It serves as a solid introduction to the platform, suitable for beginners who are familiar with tools like Tableau, Excel, and SQL. The course videos cover essential aspects of chart building and data visualization in detail, which is particularly beneficial for those transitioning from other data tools.
Pros
-
Comprehensive Introduction: The course provides a thorough introduction to Google Data Studio, suitable for beginners with some background in data manipulation tools.
-
Clear and Detailed Explanations: Video commentary is clear and detailed, making complex concepts understandable for learners without an IT background.
-
Engaging Content: The lessons are well-structured and engaging, with bite-sized content that is easy to absorb and remember.
-
Real-World Application: The course covers practical applications, allowing students to apply their knowledge efficiently in their jobs.
-
Supportive Community: The community and instructors are supportive, offering explanations and answering questions, although sometimes with a delay.
-
Ease of Following: From the first lesson to the last, the course is easy to follow, ensuring that learners can navigate and use the dashboard effectively.
-
Relevant Content: The content is relevant and up-to-date, with lessons that are interesting and applicable in today's data landscape.
Cons
-
Outdated References: Some references within the course may be outdated, such as instructions for obtaining Covid data or file corrections that precede the respective video content.
-
Missing Data: In some lectures, data is missing, which can impede practice and application of the concepts taught.
-
Limited Advanced Topics: While the course covers the basics well, it lacks more detailed exploration into advanced areas like integrating Big Query or performing complex queries.
-
Incomplete Responses to Queries: Some student questions remain unanswered, potentially leading to confusion and the need for further inquiry.
-
Formula and Function Explanation: There is a request for more coverage of the formulas and functions required in Looker Studio.
Course Experience Highlights
-
"Nice Experience with Start-Tech Academy": One reviewer praised the simple and easy-to-understand lecture delivery, which was instrumental in their learning journey despite lacking an IT background.
-
"Great Instructor!": The instructor's presentation style and ability to make lessons manageable and digestible were commended by several reviewers.
-
"Thorough Course": The course was described as thorough and helpful, enhancing efficiency in using Google Data Studio for job roles that involve data visualization.
Recommendations for Improvement
-
Update Content: Ensure all content is up-to-date, including data sources and workarounds for common issues.
-
Address Advanced Topics: Expand the curriculum to cover advanced topics such as multiple data integration and custom queries.
-
Improve Response Time: Address student questions more promptly to enhance the learning experience.
-
Provide Complete Workaround Solutions: Anticipate potential issues and provide solutions before the relevant video content for a smoother learning process.
Conclusion
Overall, the Google Data Studio Fundamentals course is a valuable resource for beginners and those with some data visualization experience. It equips learners with the skills necessary to create effective dashboards in Google Data Studio. While there are areas that could be improved, such as keeping content current and addressing advanced topics, the course remains a recommended learning path for those looking to explore data visualization and dashboard creation using Google's platform.
Charts
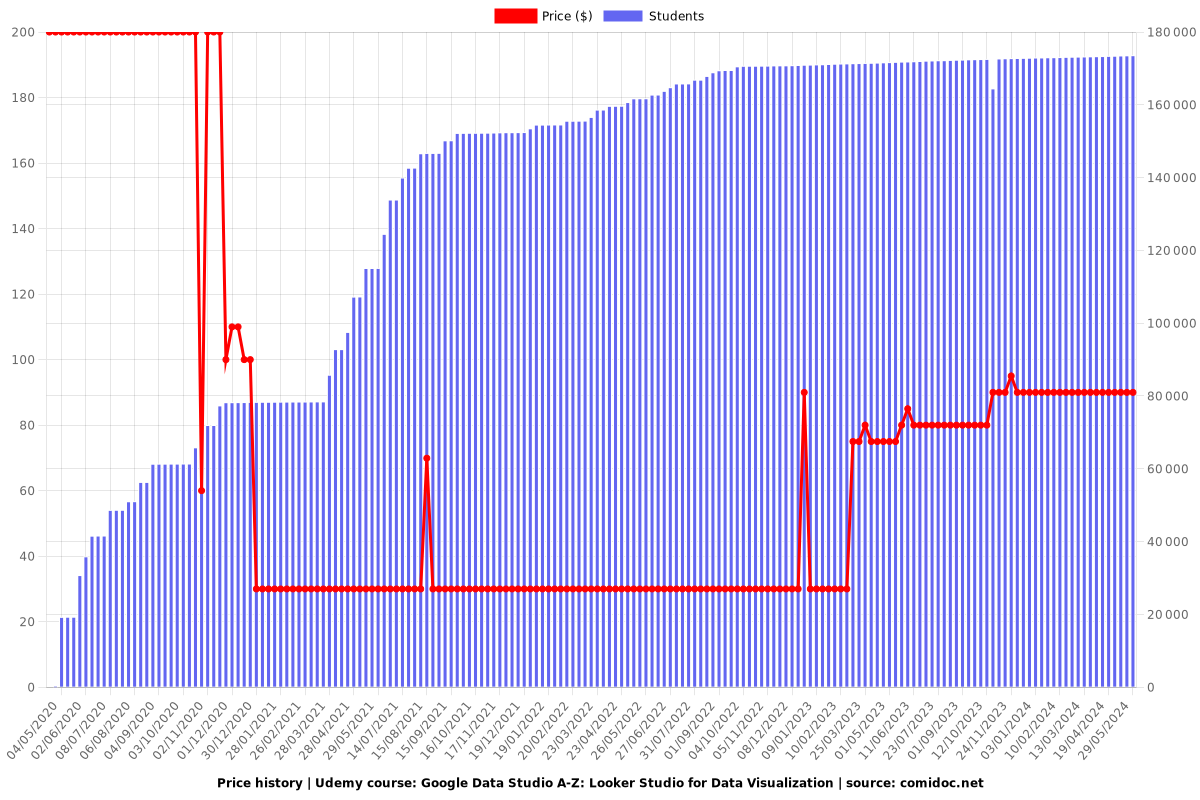
Price
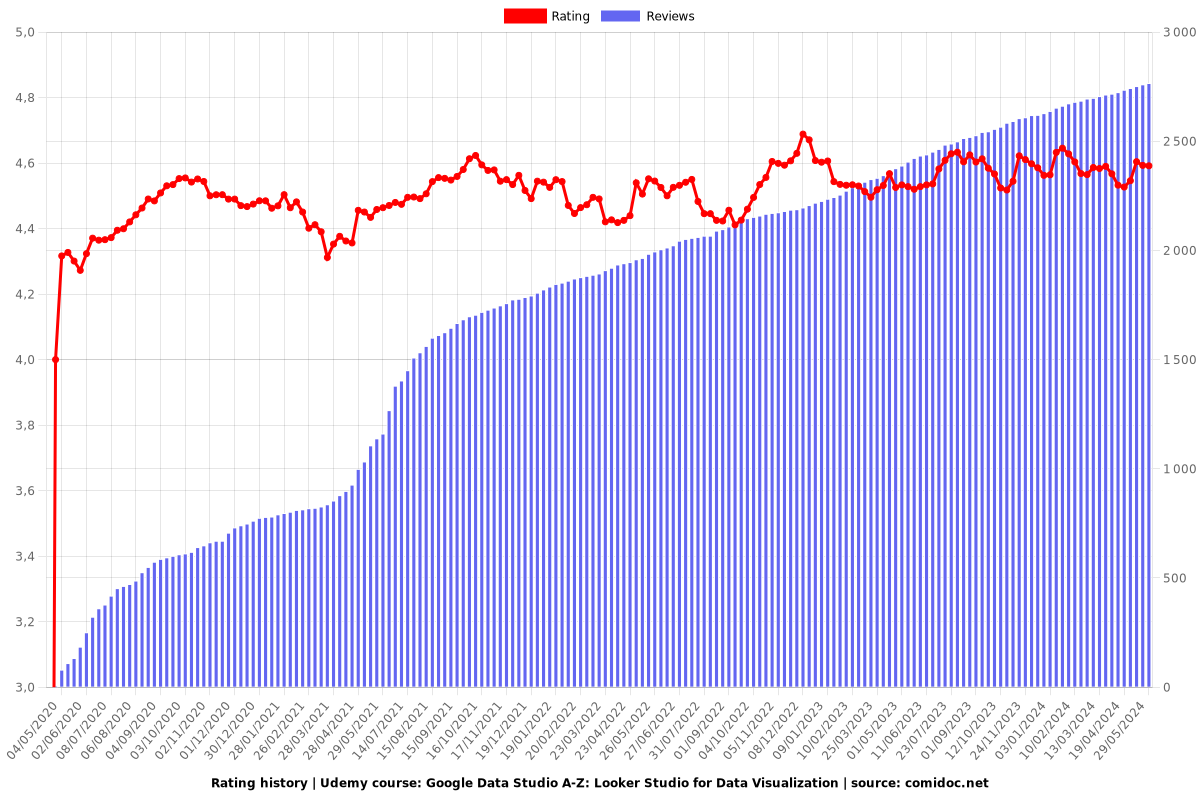
Rating
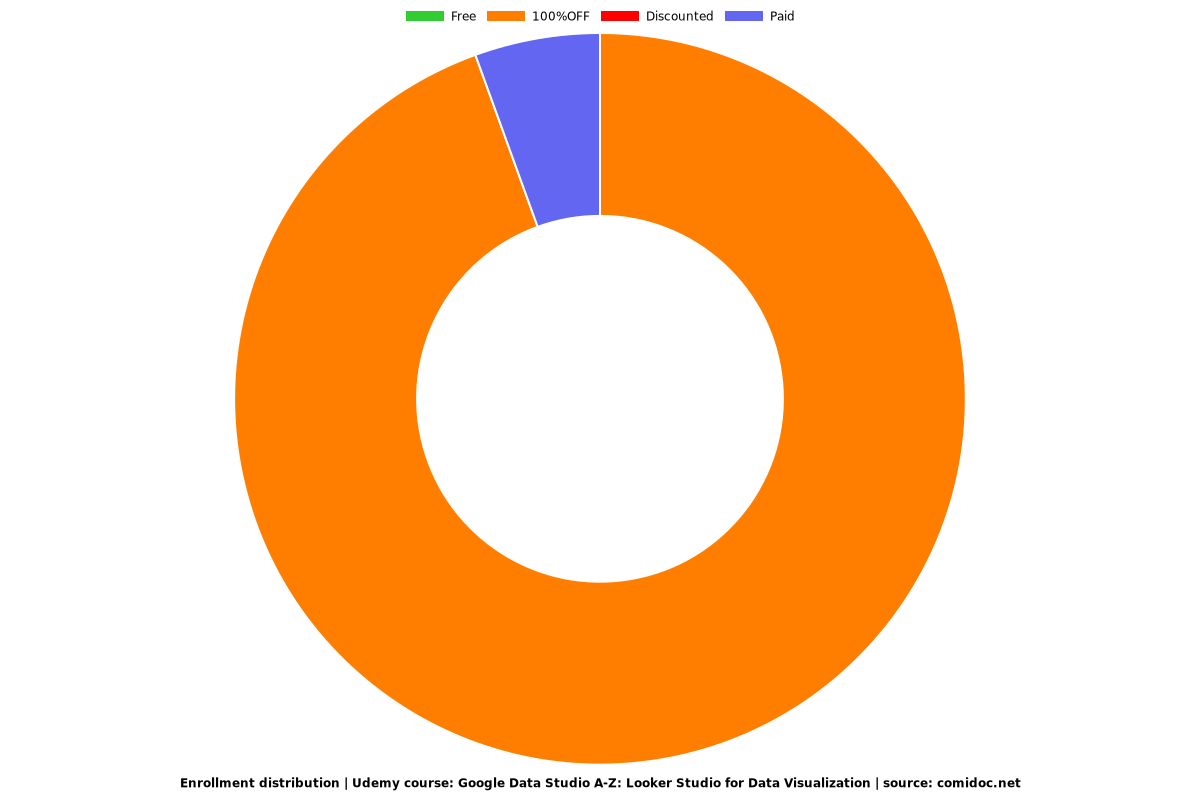
Enrollment distribution
Coupons
| Submit by | Date | Coupon Code | Discount | Emitted/Used | Status |
|---|---|---|---|---|---|
| - | 06/05/2020 | EARLYBIRD | 95% OFF | expired | |
| - | 12/05/2020 | MAY20FRE | 100% OFF | 40000/18922 | expired |
| - | 20/05/2020 | OFFEREXT | 95% OFF | expired | |
| Lee Jia Cheng | 05/06/2020 | JUNEFIR2020 | 100% OFF | 40000/11045 | expired |
| Lee Jia Cheng | 13/06/2020 | JUNESEC2020 | 100% OFF | 40000/5019 | expired |
| Lee Jia Cheng | 17/06/2020 | JUNETHR2020 | 100% OFF | 40000/5343 | expired |
| - | 08/07/2020 | OFFEREXTENDED | 95% OFF | expired | |
| - | 19/07/2020 | JUL20AD | 100% OFF | 40000/6936 | expired |
| - | 05/08/2020 | EXTENDEDDISC | 95% OFF | expired | |
| Angelcrc Seven | 08/08/2020 | AUGFR20 | 100% OFF | 40000/2248 | expired |
| - | 22/08/2020 | AUGTRI2020 | 100% OFF | 40000/4961 | expired |
| - | 04/09/2020 | NTSEPT1C | 100% OFF | 40000/4993 | expired |
| - | 26/10/2020 | OCTXXVI20 | 100% OFF | 40000/4426 | expired |
| - | 07/11/2020 | NOVVII20 | 100% OFF | 40000/6038 | expired |
| - | 28/11/2020 | NOVXXVIII | 100% OFF | 40000/6004 | expired |
| - | 29/01/2021 | BIGSALE2021 | 67% OFF | expired | |
| - | 07/04/2021 | APR1FREE | 100% OFF | 40000/7234 | expired |
| - | 16/04/2021 | APRGDSFR | 100% OFF | 40000/6910 | expired |
| - | 29/04/2021 | GDSFREAPR | 100% OFF | 40000/4676 | expired |
| - | 05/05/2021 | MAYGDSFRE | 100% OFF | 40000/9368 | expired |
| - | 20/05/2021 | GDSFREMAY | 100% OFF | 40000/7770 | expired |
| - | 19/06/2021 | FREGDSJUN | 100% OFF | 40000/9259 | expired |
| - | 30/06/2021 | GDSFRDVDB | 100% OFF | 40000/9309 | expired |
| Angelcrc Seven | 21/07/2021 | FRGDSAZJU1 | 100% OFF | 40000/5776 | expired |
| - | 01/08/2021 | GDS2FRJL | 100% OFF | 40000/2627 | expired |
| - | 19/08/2021 | GDSFRAU1 | 100% OFF | 40000/3897 | expired |
| - | 19/08/2021 | VIZOFFER | 67% OFF | expired | |
| - | 18/09/2021 | GDASTUSEPVII | 100% OFF | 40000/3390 | expired |
| - | 01/10/2021 | GDSF2SE | 100% OFF | 40000/1933 | expired |
| Ignacio Castro | 10/01/2022 | B43A4A | 100% OFF | 1000/904 | expired |
| Ignacio Castro | 16/01/2022 | JCB69C | 100% OFF | 1000/924 | expired |
| - | 21/02/2022 | FC87141 | 100% OFF | 1000/970 | expired |
| - | 23/02/2022 | DATAVIZOFF | 67% OFF | expired | |
| - | 25/03/2022 | M95A39B | 100% OFF | 1000/955 | expired |
| - | 31/03/2022 | M009BD4A | 100% OFF | 1000/832 | expired |
| Angelcrc Seven | 05/04/2022 | A9D4D1B | 100% OFF | 1000/841 | expired |
| - | 15/04/2022 | AA1ED9 | 100% OFF | 1000/841 | expired |
| - | 13/05/2022 | MEVLGF | 100% OFF | 1000/957 | expired |
| - | 25/05/2022 | HTSSCD | 100% OFF | 1000/986 | expired |
| - | 15/06/2022 | SKZHCYP | 100% OFF | 1000/978 | expired |
| - | 01/07/2022 | OCLFHAS | 100% OFF | 1000/952 | expired |
| - | 06/07/2022 | BCICPVA | 100% OFF | 1000/844 | expired |
| - | 15/07/2022 | NWWYWDO | 100% OFF | 1000/995 | expired |
| - | 12/08/2022 | RPHXNAT | 100% OFF | 1000/864 | expired |
| - | 23/08/2022 | CTYKVQM | 100% OFF | 1000/889 | expired |
| - | 06/09/2022 | PKRQBR | 100% OFF | 1000/953 | expired |
| - | 10/10/2022 | ISUAJME | 100% OFF | 1000/984 | expired |
| - | 15/10/2024 | DIWALIFREE2024 | 100% OFF | 1000/995 | expired |