Fundamental Market Analysis with Python
Find Your Own Answers On What Is Going on in the Financial Markets

What you will learn
Learn how to analyze the stock market and answer your own questions
Find the right data sources to help you answer fundamental market questions
Know where to find reliable and free data sets to answer your market questions
Use Python and Jupyter notebooks to prepare, explore, and chart data
Why take this course?
This course covers the critical fundamental indicators to help navigate the financial markets and answer your own questions without relying on the opinion of others. Learn to find your way around the chaotic world of the financial markets.
Whether you are a trader, a financial analyst, a data scientist, or just a curious person that wants to be informed, this class is for you. I will show you where to get free and reliable data, how to analyze and plot that data using Python and Jupyter notebooks (I do expect you to know a little python).
We’ll start with the S&P 500, my favorite index and the world’s economic barometer. This powerful and telling index comprise some 80% of all equity market value in the United States and 30% of its revenue comes from outside the US. If you only have time for one fundamental indicator - this is the one! We’ll continue by exploring the VIX, the Yield Curve, The Case-Shiller Home Price Index, the CPI, PMI, BCI and much more.
Here is a sample of the lectures (all lectures with code come with a link to download the Jupyter notebook).
S&P 500 - Economic Barometer of the World
VIX - The Fear Index
Market Movements
Consumer Price Index (CPI) and Inflation
Real Estate - Case-Shiller Index, CPPI, VNQ
Unemployment and the Labor Pool
Bankruptcies
Oil & Gold Decoupling
Bitcoin
Yield/Inverted Yield Curve
Dividends, Dividend Yield
Business Confidence Index (BCI)
Purchasing Managers' Index (PMI)
Retail Numbers
Custom Indexes
Bogleheads Investments
COT - Commitment of Traders
Candlestick Charting
Background Coloring
RSI - Relative Strength Index
MACD - Moving Average Convergence/Divergence
OBV - On-Balance Volume Technical Indicator
ROC - Rate of Change
...
Screenshots


Reviews
Charts
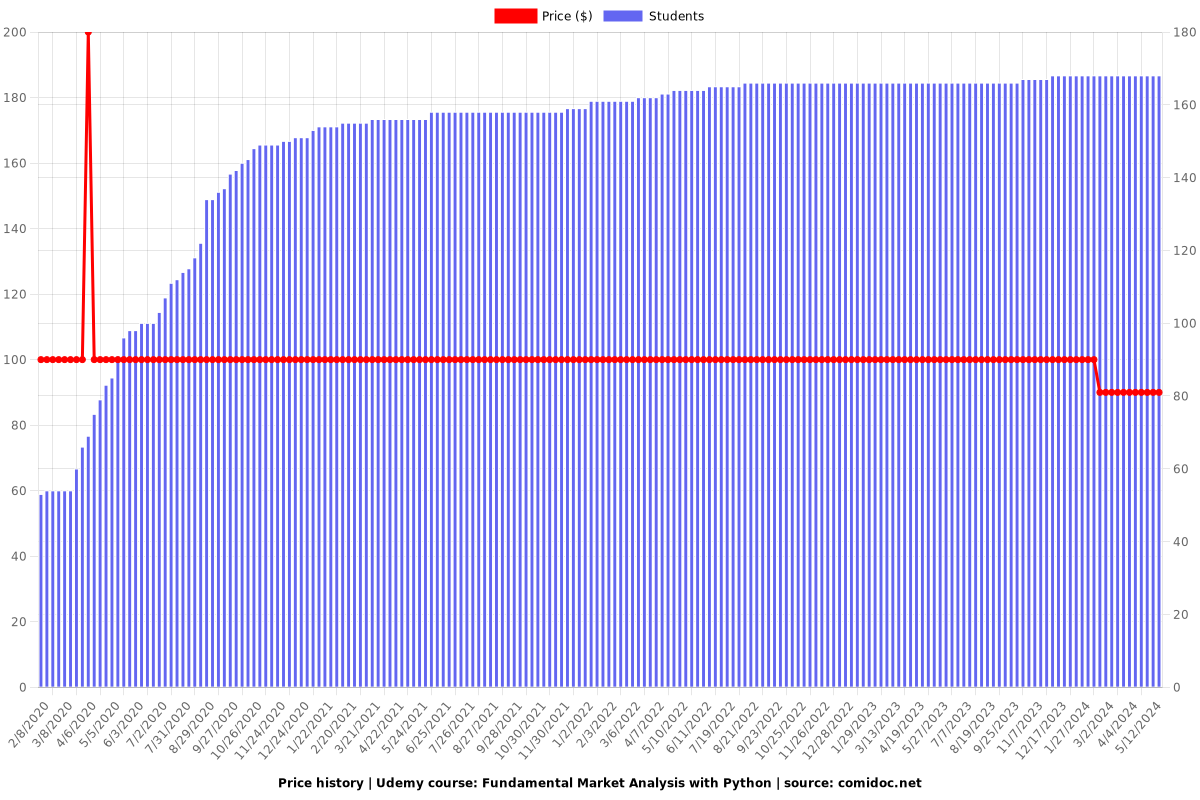
Price
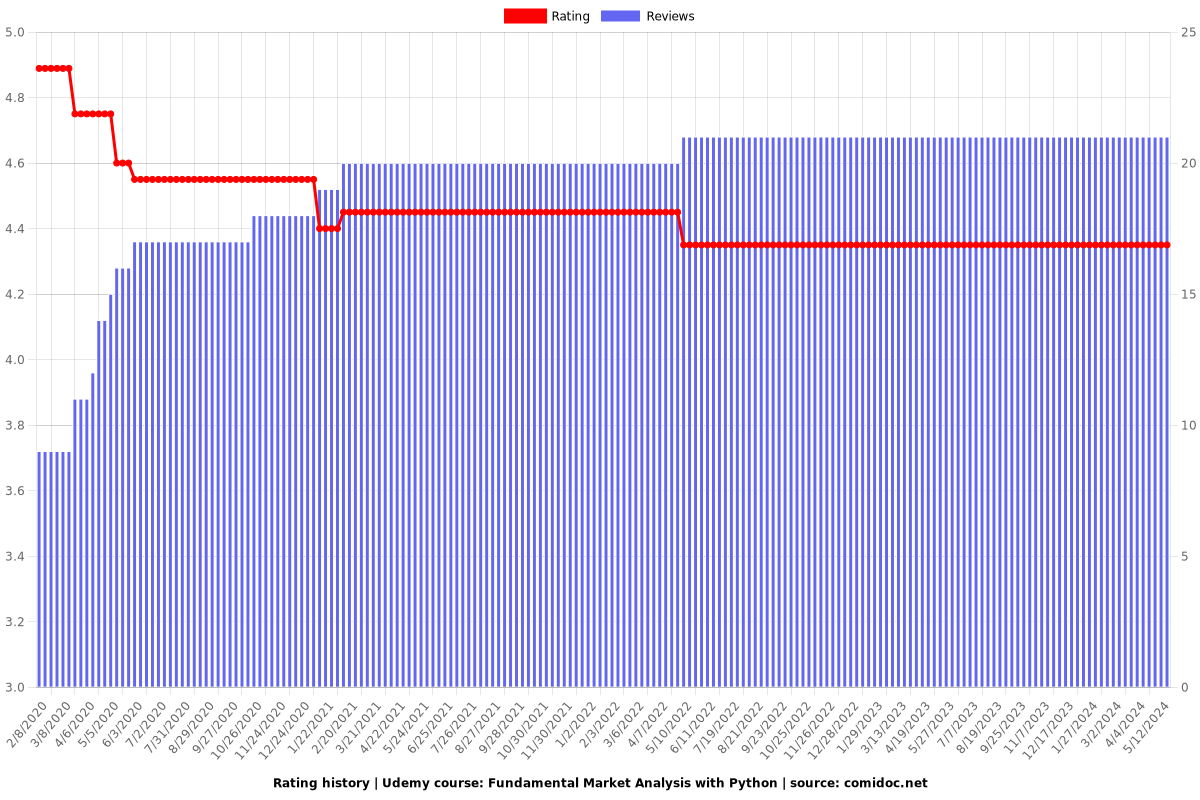
Rating
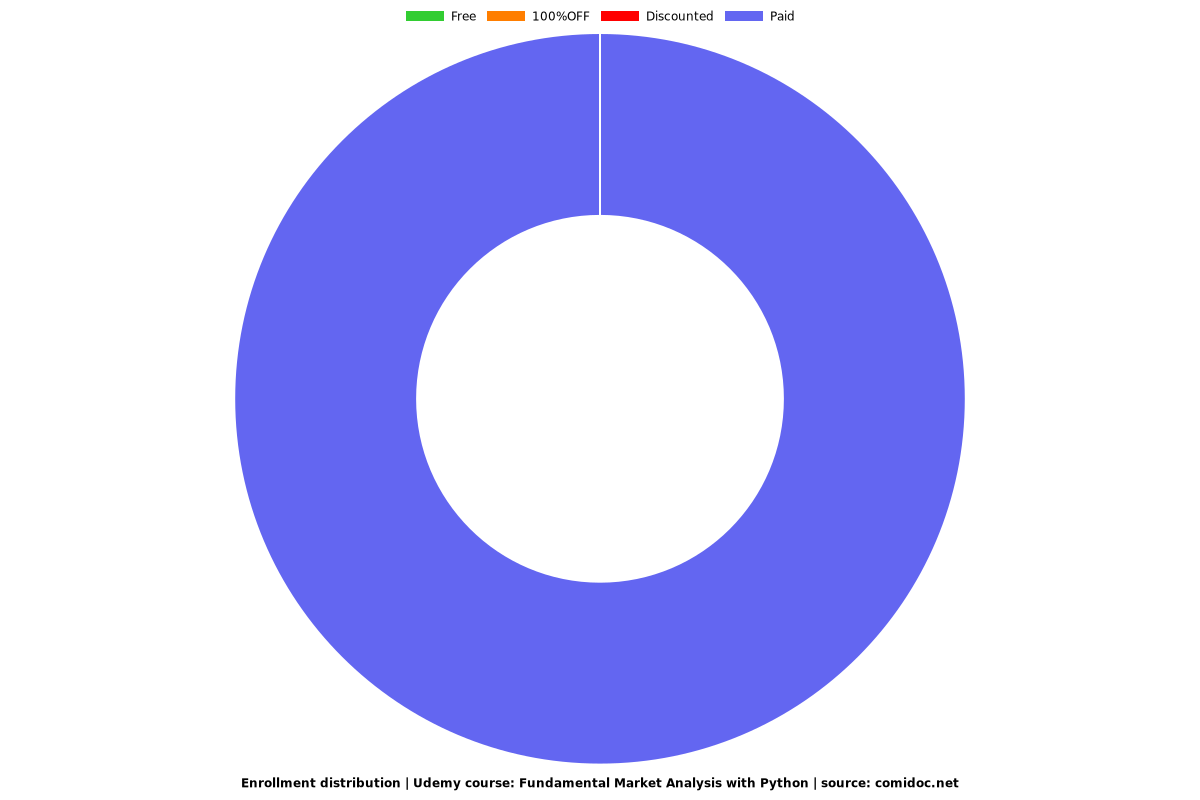
Enrollment distribution