Power BI Mastery: Advanced Financial Data Analysis Power BI
Power BI Mastery: Building Expert Financial Analysis Dashboards with Power BI

What you will learn
The importance of Power BI Financial Analysis
Power BI and why Power BI is important
How to work on Power BI
Analyzing Sales Calculation and Matrix Formatting
How to prepare P&L, calculate profits, KPI for visualization, and Data Slicers
The whole procedure of Power BI Financial Analytics, from installing to comparing data with steps
How to compare Power BI with MS Excel
The resources of Power BI Financial Analyst
The visualization features such as visualizing sales trends and adding slicers
Analyze P&L as charts for P&L, Comparison for P&L, and Analyze
• And much more…
Why take this course?
Are you eager to establish a robust and efficient Power BI system for your business?
Do you aspire to master sales calculations, analyze sales trends, and visualize data effectively?
Are you ready to become a proficient expert in preparing Profit & Loss Statements, creating visualizations, and conducting financial data analysis?
Look no further! This comprehensive course is tailored just for you.
Power BI, introduced by Microsoft in July 2011, is a versatile business intelligence tool that can amalgamate disparate data sources into a unified, insightful view.
But Power BI isn't solely for financial data analysis; it's a versatile tool that can streamline operations across various departments such as manufacturing, marketing, logistics, customer relations, human resources, sales, and more. The tool empowers users to view departmental data in an interactive, comprehensible, and visual format.
The standout feature of Power BI is its capability to transform raw, unconnected data into meaningful, actionable, and interactive insights. By rendering data in a user-friendly and reliable format, Power BI simplifies decision-making processes.
Our course is your complete guide to mastering Power BI, starting from installation to advanced visualization techniques. Each module provides in-depth theoretical knowledge accompanied by practical applications.
We commence with a comprehensive introduction to Power BI, including installation procedures. In the third module, we delve into monthly and quarterly data analysis. The final module explores various financial analysis terms, such as gross profit, EBITDA, and net profit.
Our course's strength lies in its progression from fundamental concepts to advanced Power BI techniques. You'll learn how to evaluate data efficiently using various operations on datasets.
Designed for beginners with no prior experience in Data Analysis, Power BI, or Data Representation, this course offers:
Clear and concise explanations
In-depth and practical knowledge
Focused and relevant content
Hands-on experience with real-world scenarios
Step-by-step guidance to set up customized Power BI systems for any business
Our course materials prioritize experiential learning, allowing you to dive deep into Power BI's financial data analysis capabilities. You'll become proficient in sales calculations, monthly and quarterly sales analysis, and data visualization using charts. Additionally, you'll master the preparation and analysis of Profit and Loss Statements.
Why Choose This Course?
Simplified complex statistical modeling principles
A structured approach to understanding the role of Power BI in real-world applications
Three hands-on case studies to develop complete Power BI solutions for custom datasets
A concise learning-by-doing format that ensures mastery of Power BI concepts and methodologies, especially in financial data analysis
Our passionate teaching style makes learning effective, easy, and enjoyable. We've crafted online tutorials that encourage hands-on learning. You'll explore practical applications of Power BI using financial data and data evaluation, moving beyond superficial knowledge. The course instructor has worked diligently to ensure a clear understanding of theoretical concepts before transitioning to more complex topics
Course Highlights:
Installation and usage of Power BI Desktop
In-depth analysis of Power BI's Analysis feature
Sales calculation, analysis, and trend visualization
Profit & Loss Statement preparation, visualizations, and chart creation
Gross Profit, EBITDA, and Net Profit analysis using Power BI
Practical insights into data visualization with cards, numbers, and data slicers
Chart creation and data analysis techniques
Enroll in this course today to become a Power BI expert. Upon successful completion, you'll be equipped to:
Apply Power BI concepts to financial data analysis in various domains
Perform data operations and evaluations efficiently using Power BI
Create compelling visualizations for monthly, quarterly, and yearly analyses
Who Should Take This Course?
Beginners eager to explore Power BI
Data analysts seeking to enhance their skills
Business analysts looking to optimize financial analysis
Financial analysts aiming to streamline data processes
Data science enthusiasts eager to expand their skill set
Research scholars and data scientists
Don't miss the opportunity to master Power BI for financial data analysis. Register now and embark on your journey to becoming a Power BI expert!
List of Keywords:
Power BI
Data Analysis
Financial Data Analysis
Data Visualization
Profit & Loss Statements
Gross Profit
EBITDA
Net Profit
Sales Calculation
Monthly Analysis
Quarterly Analysis
Business Intelligence Tool
Data Representation
Customized Power BI Systems
Installation Procedures
Data Operations
Data Evaluation
Business Analysts
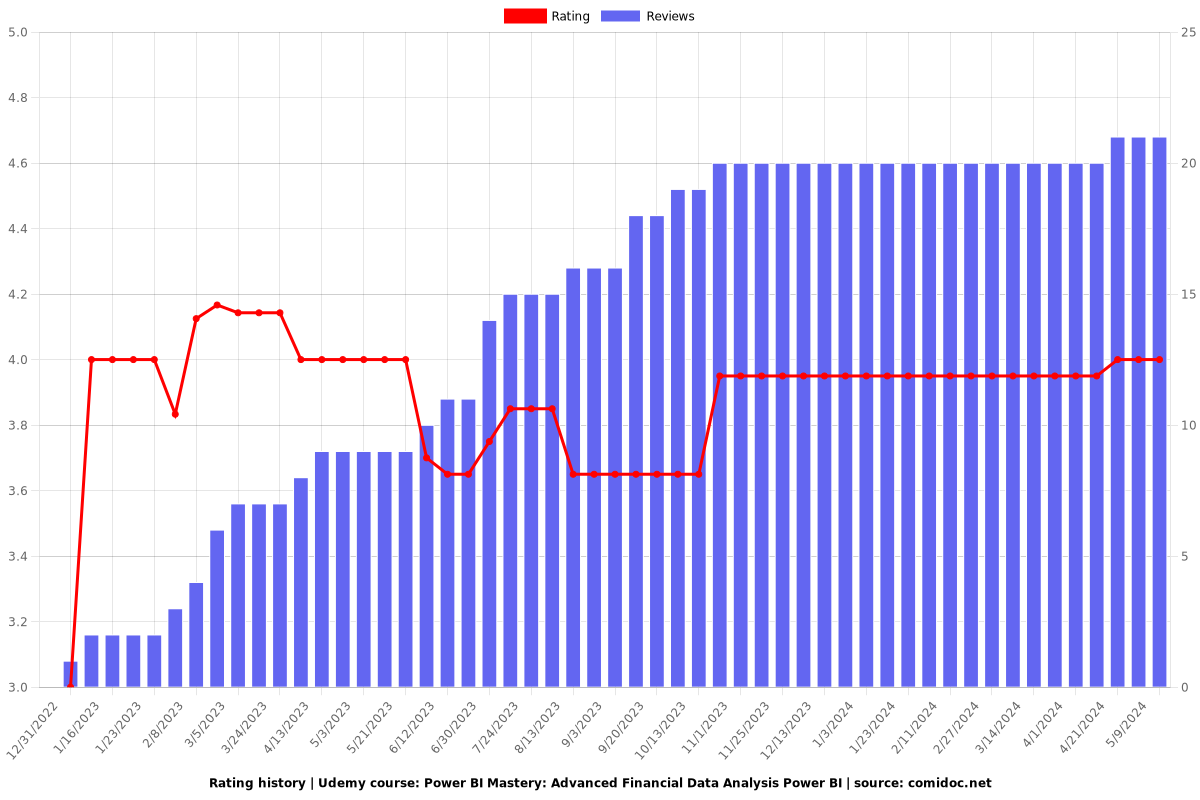
Reviews
Charts
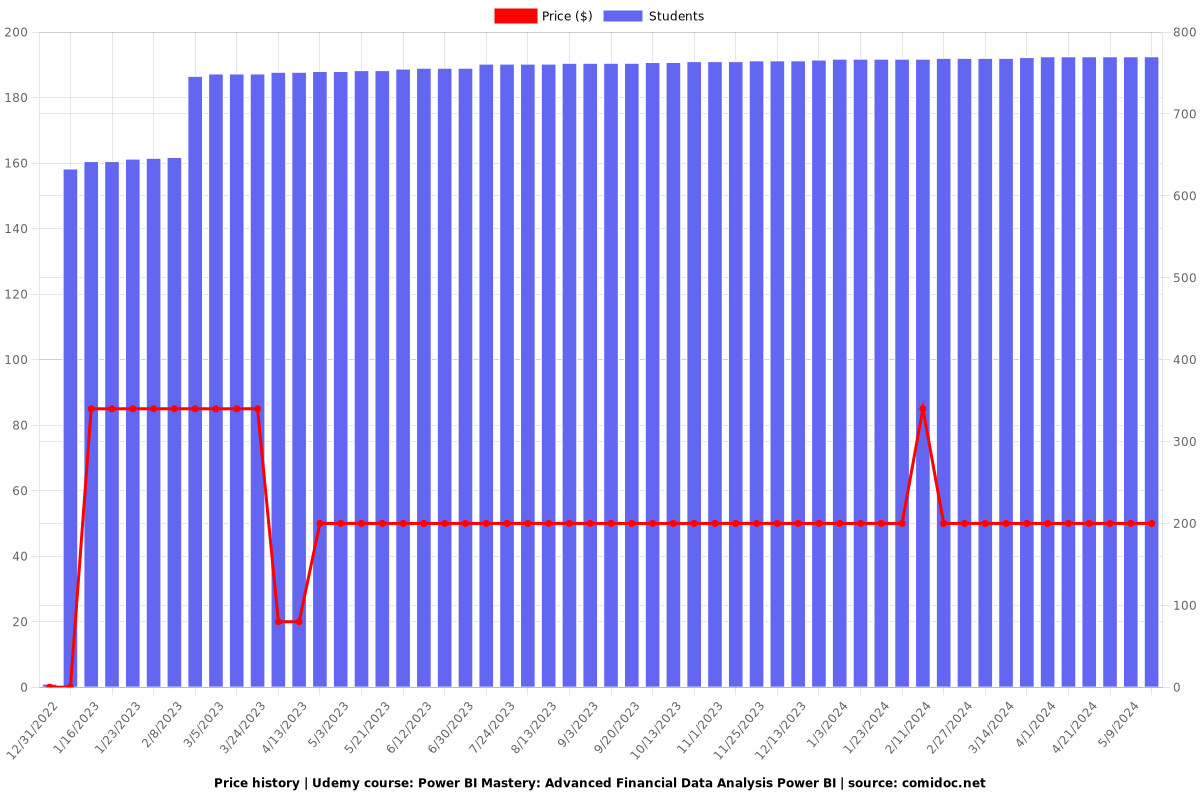
Price
Rating
Enrollment distribution