Microsoft Power BI - level up Data analysis & Visualisation
Master the fundamentals by creating projects from scratch & following real-life business examples. Sample data included

What you will learn
Master Power BI and Data Visualisation
Import Data and Model via Power Query
Data Visualisation principals
Explicit and Implicit measures in Power BI and how to use in data analytics
Publishing and Sharing reports
Understand and implement data modeling techniques in Power BI, including relationships, calculated columns, and measures for more complex data analysis
Why take this course?
The Power BI course is designed to empower you with skills in Data Analysis Expressions (DAX) and Data Visualization using Power BI Desktop, Power View, and Power Map. Developed by Microsoft, Power BI is a robust business analytics service offering versatile data modeling capabilities, including data preparation, data discovery, and interactive dashboard creation.
Power BI serves as a versatile tool, capable of transforming data from various sources into interactive dashboards and business intelligence (BI) reports. Whether you're connecting to an Excel workbook or a local database for quick tasks, or you require enterprise-grade capabilities for real-time analytics in larger organizational contexts, Power BI adapts accordingly.
In this course, you will not only gain a solid theoretical foundation but also practical experience through real-life projects. You'll work with various services related to storage, networking, databases, and computing. Our live instructor-led Power BI training ensures hands-on exposure to real-time projects, enhancing your proficiency.
No prior technical expertise is necessary for this Power BI course, although a basic familiarity with Microsoft Excel and formulas can be advantageous. Upon enrolling, you will acquire the following skills:
1. **Data Visualization and Integration Concepts**
2. **In-depth understanding of Power Pivot, Power Excel, Power Map, and more**
3. **Proficiency in DAX (Data Analysis Expressions) and Measurement**
4. **Data Binding and Formatting Mastery**
5. **Adeptness in Power BI Embedded and Workspace Collection**
Your Instructor, Mr. Manish, is a seasoned finance professional with over two decades of experience, currently serving as a CFO in a large hotel chain. With a decade of decision-making experience using tools like Excel, Power Pivot, and Power BI, Mr. Manish is dedicated to sharing his knowledge with fellow finance professionals, enabling them to harness the power of these tools in their daily roles.
Charts
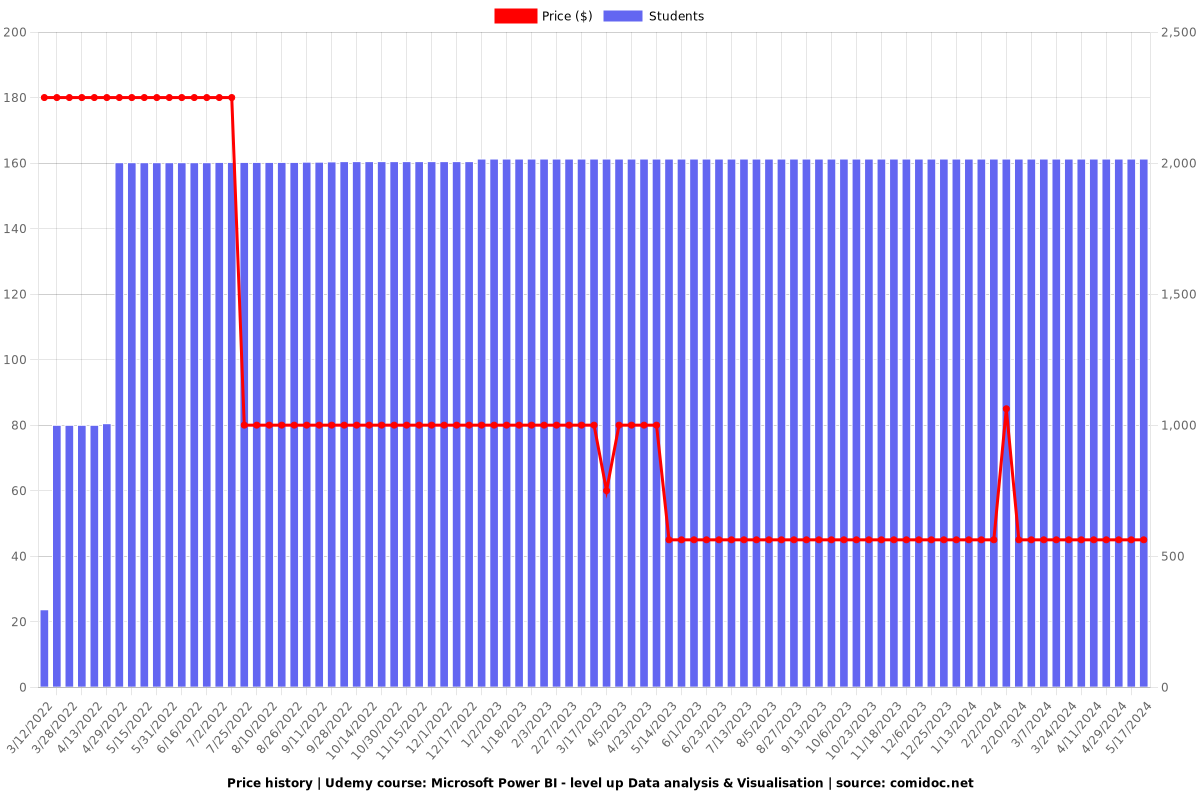
Price
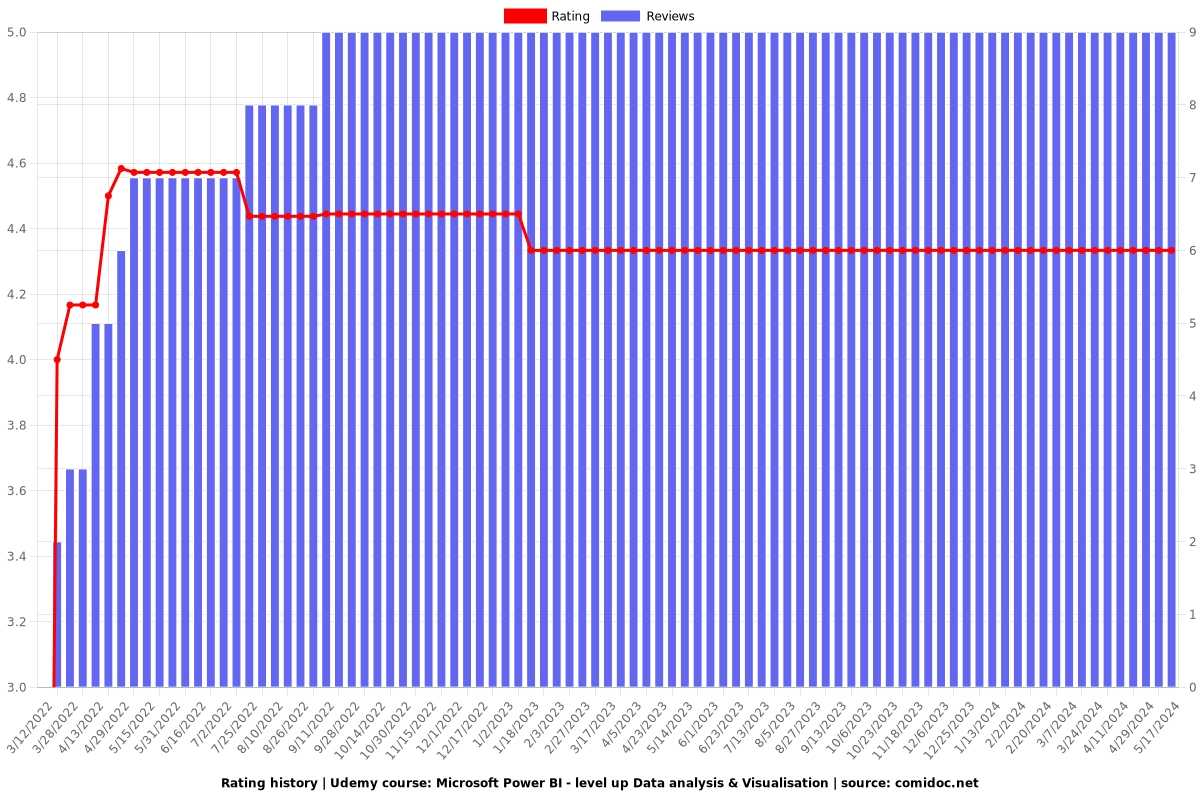
Rating
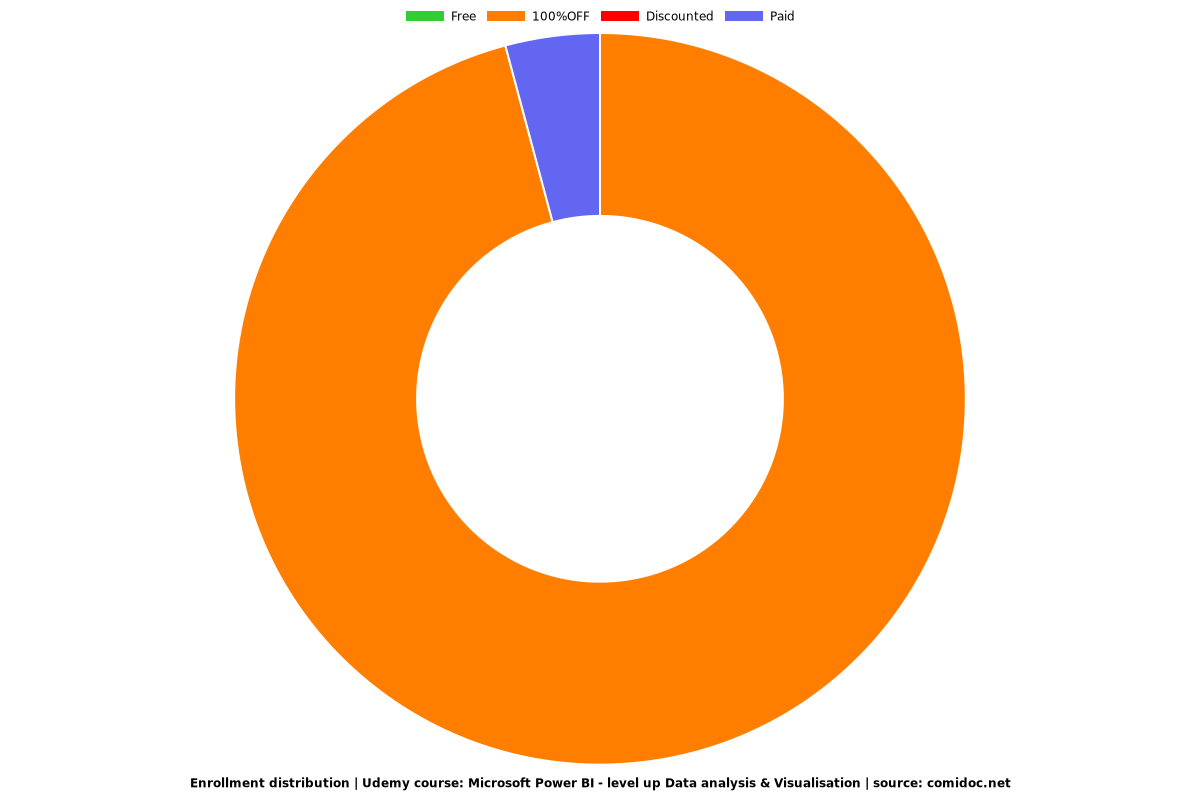
Enrollment distribution