ERPNext Frappe script report creation and coding
ERPNext and Frappe training for creating script reports

What you will learn
ERPNext implementors, consultants, programmers, accountants and small business owners
1000 Dollars
No risk
SQL creation , coding
Why take this course?
In this session, we create a script report with
Report summary
Graph with two legs
Data listing
Color the value with condition
Message
Client side scripting
SQL
and a little bit of Query report.
Lets start by creating simple message
Standard - NO
***** Note: Lot of indent issues with the following codes, please fix it if you are copying the code. Better you write on your own
data = columns, data, "Hello, here is my stock summary, graph and details", chart, report_summary
data = None, None, "Lets learn Script reporting", None, None
Now lets have two colums
columns = ["Letter","Number","Colour"]
mydata = [['Row-1',2,'Red'],['Row-2',2,'Blue'],['Row-3',8,Yellow'],['Row-4',7,'Violet']]
data = columns, mydata, "Lets learn Script reporting", None, None
Color it
columns = ["Letter","Number","Colour"] # list
mydata = [['Row-1',2,'<span style="color: red;">Red</span>'],['Row-2',2,'Blue'],['Row-3',8,'Yellow'],['Row-4',7,'<span style="color: violet;">Violet</span>']] # list within list
data = columns, mydata, "Lets learn Script reporting", None, None
lets do report summary
report_summary = [
{"value": "100", "label": "label1", "datatype": "Data"},
{"value": "200", "label": "label2", "datatype": "Data"},
{"value": "300", "label": "label3", "datatype": "Data"}
]
data = None, None, None, None, report_summary
Have a total
Just tick the box
Lets plot a graph
columns = ["Letter","Number"]
data = [['c',2],['a',2],['t',8],['s',7]]
mydataset = {"values": [3000, 6500, 4250, 1000]}
chart = {'data':{'labels':['Saudi','Qatar','UAE','Oman'],'datasets':[mydataset]},'type':'bar'}
data = columns, data, None, chart, None
Charts
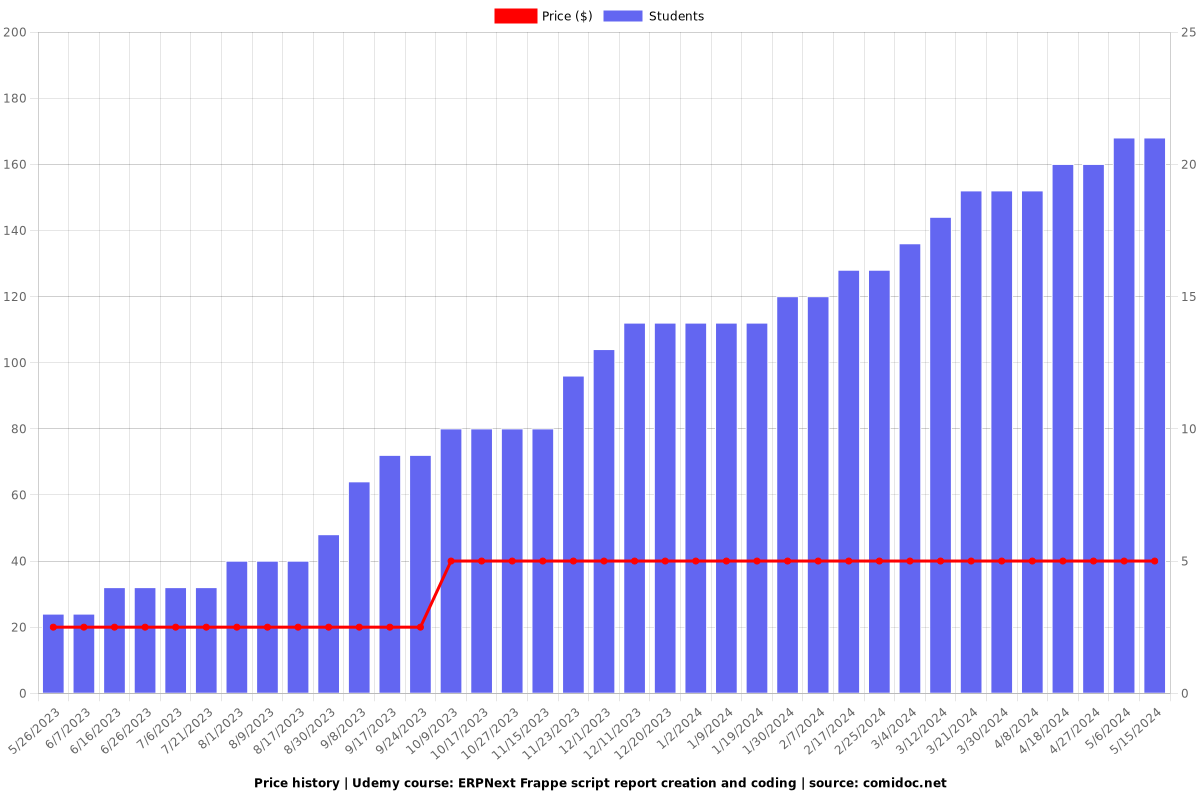
Price
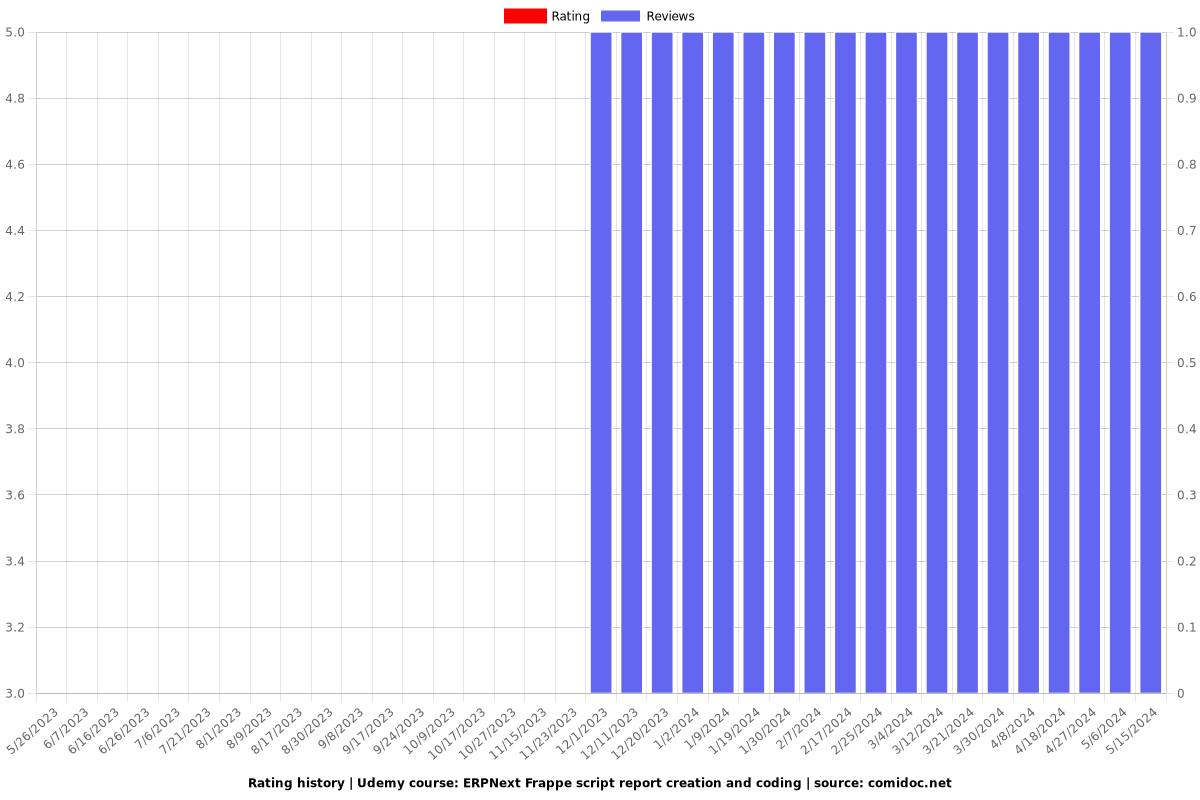
Rating
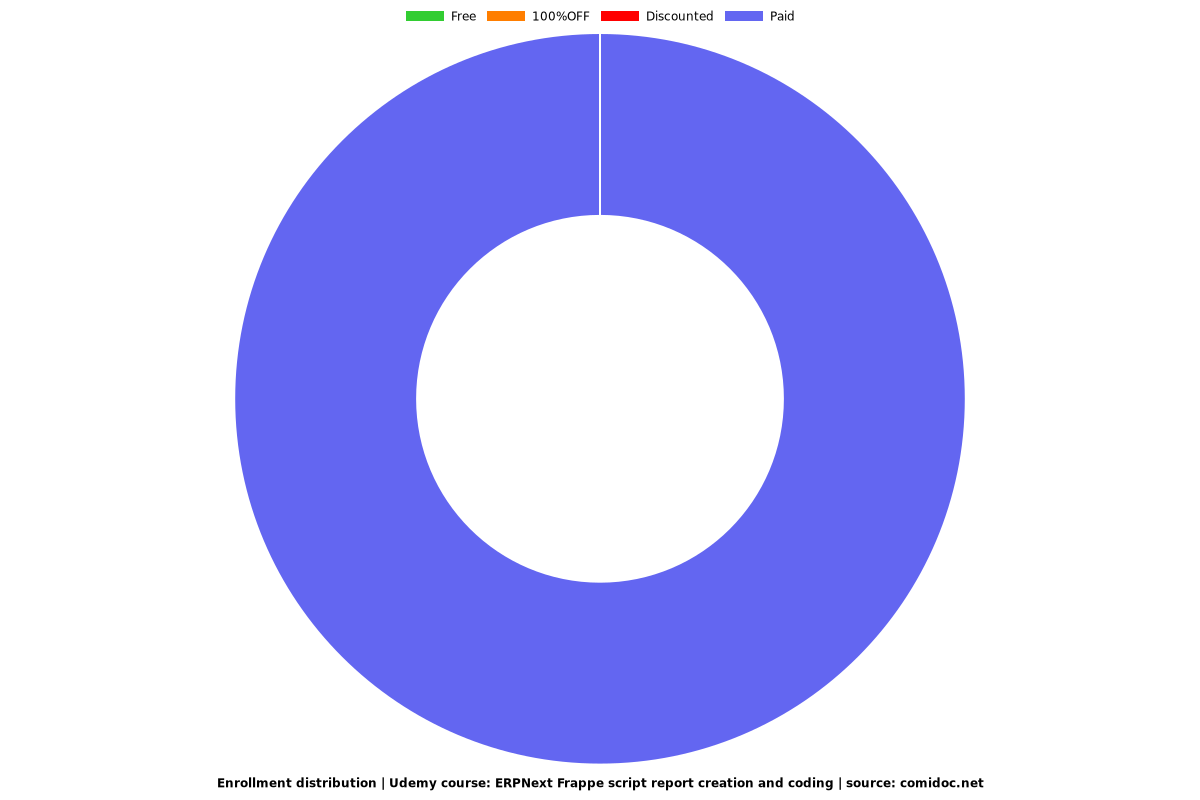
Enrollment distribution