Data Visualization with Excel - Crash Course
Learn Excel for Business. Learn the most useful features of excel to develop business dashboards.

What you will learn
Data Visualization
Pivot Tables
Basic Excel
Why take this course?
1. Learn to create a database and some excel formulas and shortcuts common for people in Universities and Corporate roles.
2. Learn to create different metrics and KPI's (Key Performance Indicators) from the main database in the form of Pivot Tables which update automatically when you update data in the main table.
3. Learn to visualize data in the database in the form of different charts which automatically update when you update the data in the table.
Benefits:
Improved Communication: Data visualization enables you to present information in a visually appealing and easily understandable format. By creating compelling charts, graphs, and dashboards in Excel, you can convey your insights and findings to others in a clear and concise manner, facilitating better communication and decision-making.
Enhanced Decision-Making: Data visualization empowers you to make informed decisions based on a visual representation of data. By transforming raw data into visually appealing charts and graphs, you can quickly identify key insights, make comparisons, and identify outliers or anomalies, helping you make more accurate and data-driven decisions.
Increased Efficiency: Excel offers a wide range of data visualization tools and features that can streamline your data analysis and reporting processes. By mastering these tools, you can save time and effort by automating tasks, creating reusable templates, and generating dynamic visualizations that update automatically when new data is added.
Versatility: Excel is a widely used and versatile tool for data analysis and visualization. By becoming proficient in data visualization techniques with Excel, you can apply your skills to various industries and roles. Whether you work in finance, marketing, operations, or any other field, the ability to visualize data in Excel will be highly valuable.
Career Advancement: Proficiency in data visualization with Excel is a sought-after skill in today's data-driven world. By acquiring these skills, you can enhance your resume and open up new career opportunities. Many organizations value professionals who can effectively communicate data insights, and having data visualization expertise with Excel can give you a competitive edge in the job market.
Cost-effective Solution: Excel is a widely available and affordable tool for data visualization. Unlike specialized software or tools, Excel is commonly used in organizations, making it a cost-effective solution for visualizing data. By leveraging Excel's capabilities, you can achieve impressive data visualizations without the need for additional investments in software or tools.
Continuous Learning: Learning data visualization with Excel is a stepping stone towards developing your data analysis and visualization skills further. Once you grasp the fundamentals in Excel, you can explore more advanced tools and techniques, such as Power BI or Tableau, to take your data visualization capabilities to the next level.
Empowering Data-Driven Culture: By acquiring data visualization skills with Excel, you can contribute to fostering a data-driven culture within your organization. You can empower your colleagues and stakeholders to make data-informed decisions by presenting data in a visually compelling and accessible manner.
Overall, learning data visualization with Excel equips you with the ability to effectively analyze and present data, enhances your decision-making capabilities, and provides you with valuable skills for career advancement in a data-driven world.
Screenshots


Reviews
Charts
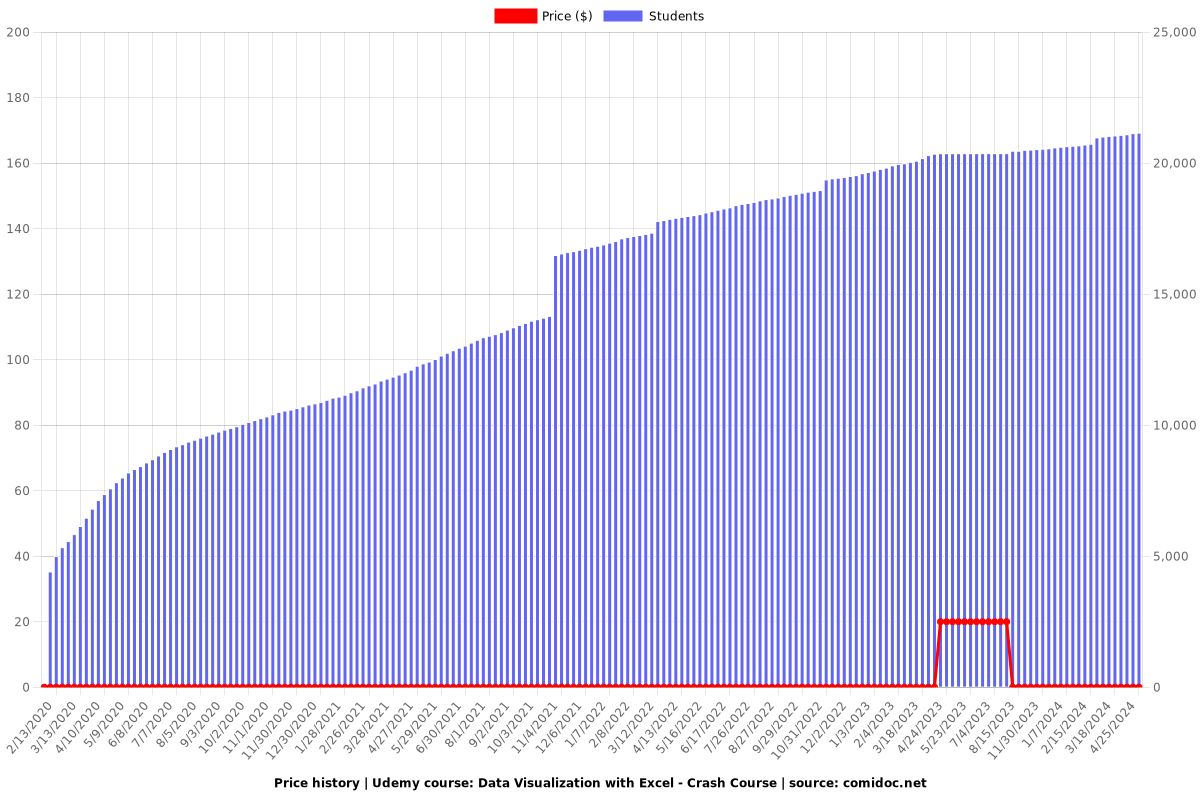
Price
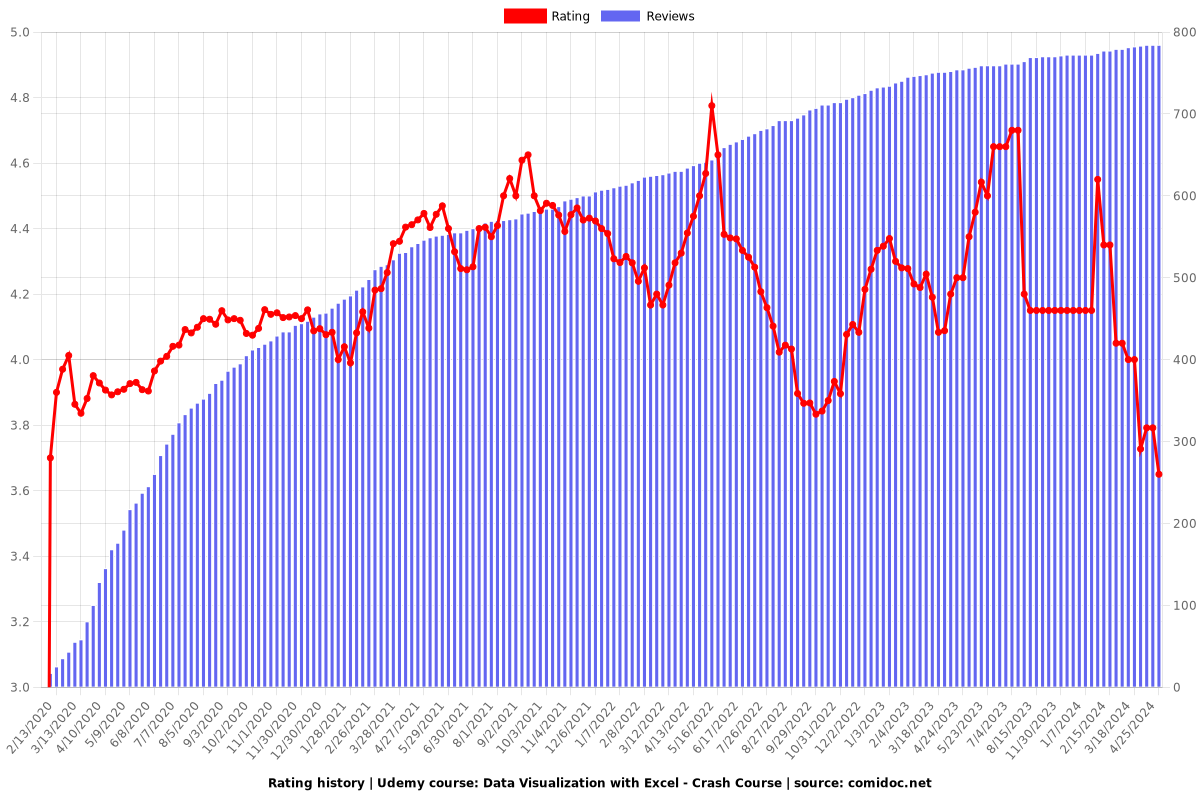
Rating
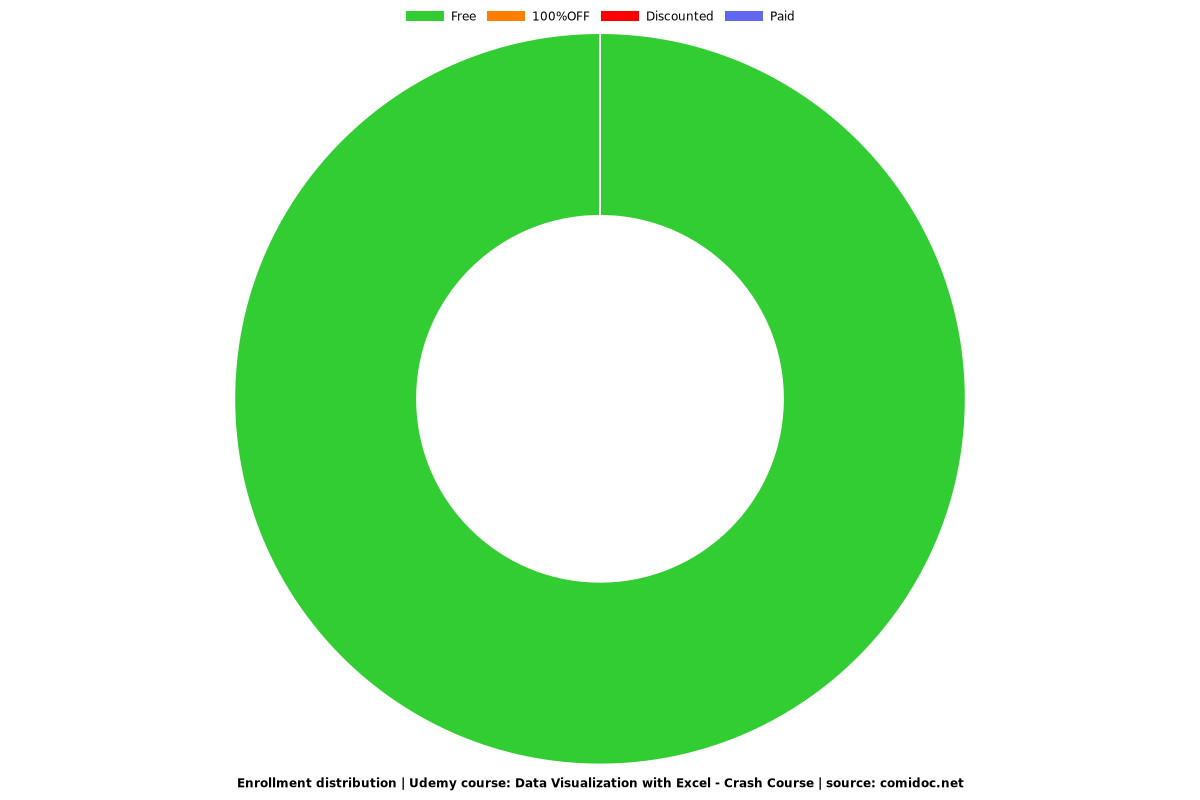
Enrollment distribution