Data Visualization in Excel: All Excel Charts and Graphs

25+ Excel charts and graphs - Data Visualization in Microsoft Excel - visualizing data with Excel 2007- Excel 2019

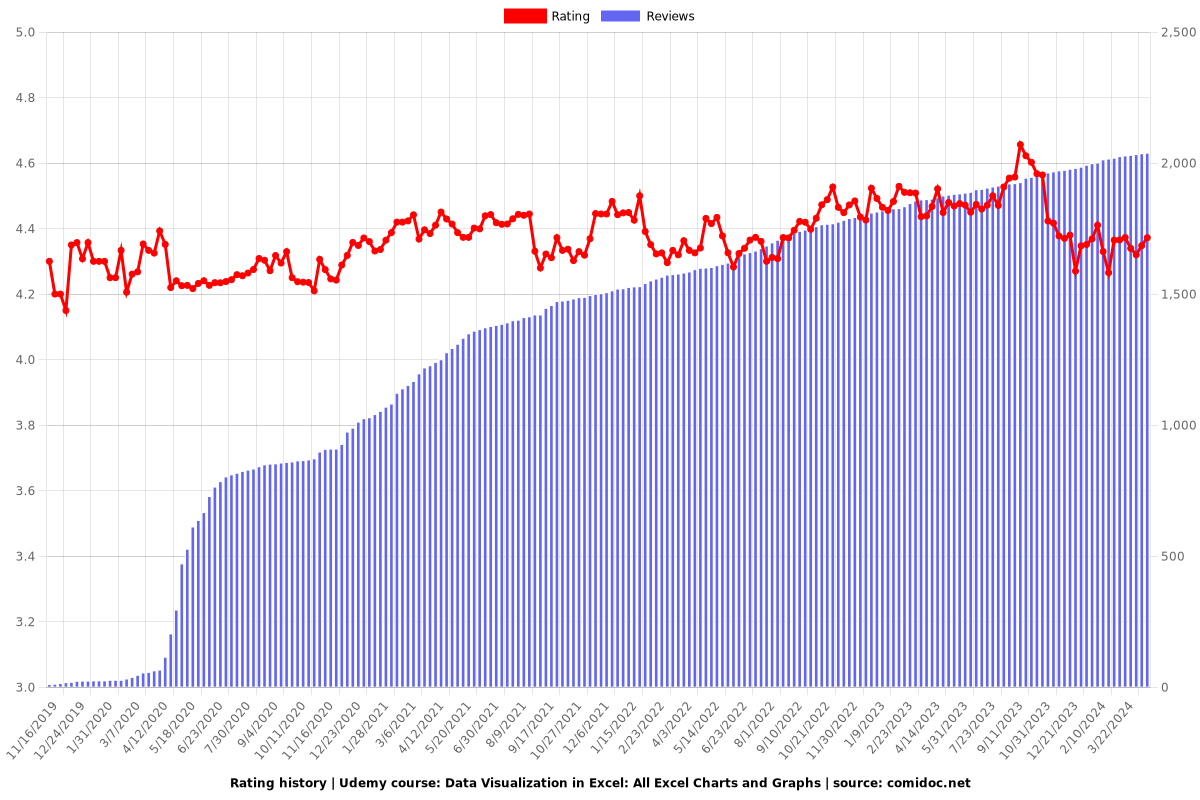
4.35 (2036 reviews)
Udemy
platform
English
language
Data & Analytics
category
Data Visualization in Excel: All Excel Charts and Graphs
159,322
students
4.5 hours
content
Jan 2024
last update
$84.99
regular price

What you will learn

Learn the techniques to communicate clear and concise message through your charts

Learn how to create 25+ chart types in Excel

Learn by Doing. Course comes with numerous exerises sheets to practice learnt concepts

Master the art of creating impactful Excel charts

Get familiar with all the elements of charts in Excel

Become proficient in using powerful tools such as pivot tables and pivot charts

Master newly introduced chart types such as sunburst, treemap and waterfall chart

Learn how to create cool infographics to represent data

Why take this course?

What are the chart types I will learn in this course?

Excel offers the following major chart types. All of these are covered in this course

  •     Column Chart

  •     Line Chart

  •     Pie Chart

  •     Doughnut Chart

  •     Bar Chart

  •     Area Chart

  •     XY (Scatter) Chart

  •     Bubble Chart

  •     Stock Chart

  •     Surface Chart

  •     Radar Chart

  •     Combo Chart

  •     Pivot Chart

  •     Sparklines

And many other creative ones :)


How are charts useful in Excel?

A chart is a tool you can use in Excel to communicate data graphically. Charts allow your audience to see the meaning behind the numbers, and they make showing comparisons and trends much easier.


What are the benefits of using charts in Excel?

Excel charts allow spreadsheet administrators to create visualizations of data sets. By highlighting a set of data within an Excel spreadsheet and feeding it into the charting tool, users can easily create various types of charts in which the data is displayed in a graphical way.


This course will answer all the questions that would pop up while you set to visualize your data using Excel charts such as:

How do you make Excel charts look better?

How do you format a chart in Excel?

What are the different elements of charts?

How do I make those awesome infographics that I see in fancy magazines and TV reports?

How do I create a comparison chart in Excel?

What is the best chart to use for comparison?

And many more...


How is this course different from other resources available online?

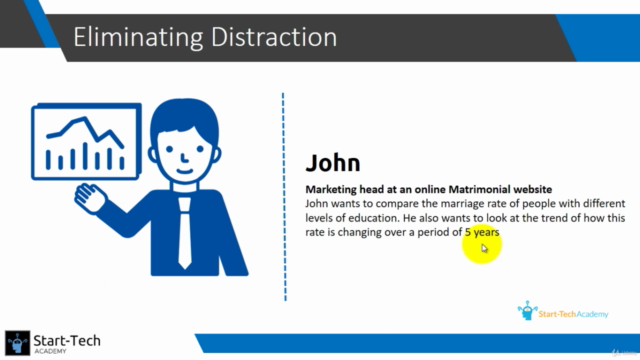
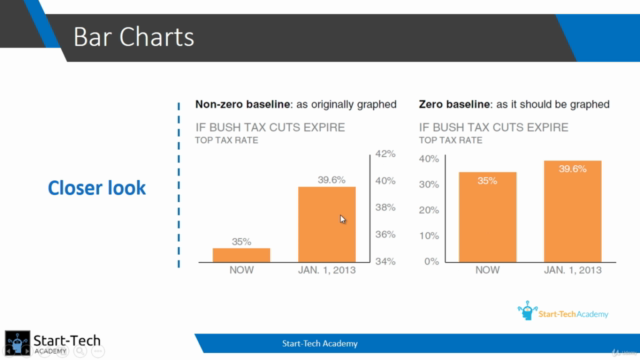
Most courses cover only teach how to draw different types of charts in Excel. The main point is missed. The main point of creating a chart is that you want to convey a message or tell a story using the chart. In this course, once you have learnt all the charting tools, you will also learn how you should create a chart. How you can highlight your message and avoid clutter in the chart, so that when your audience looks at the chart, the message is clearly conveyed to them.


Screenshots
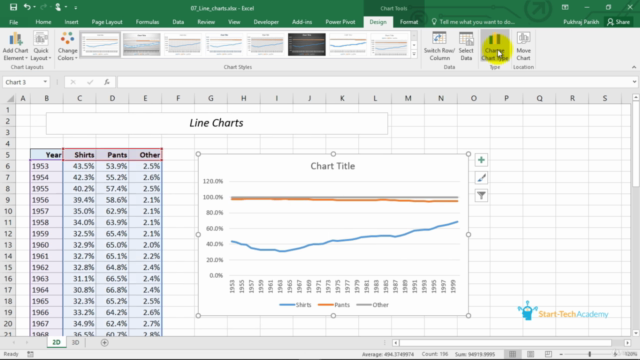
Data Visualization in Excel: All Excel Charts and Graphs - Screenshot_01Data Visualization in Excel: All Excel Charts and Graphs - Screenshot_02Data Visualization in Excel: All Excel Charts and Graphs - Screenshot_03Data Visualization in Excel: All Excel Charts and Graphs - Screenshot_04

Reviews

Snigdha
March 16, 2024
It a good course for beginners. I liked the chart element and its explanation. The infographics part needed more content and demonstration. Overall satisfied. Thank you!
Christine
February 8, 2024
The lessons make sense but I'm totally lost with the exercises. Looking at the "solutions" documents I would literally need you to walk me through how you did all that fanciness. They seem a lot more complicated than the examples in the lessons. Slow down, walk us through the exercises. Lost.
Md.
January 4, 2024
The course is overall good enough. Every content is understandable. However, the course mostly contains the basics of Excel charts and graphs. It would be much more effective if there were some advanced features, formatting options, and elements included in this course. This is perfect for someone who wants to start their Excel charts and graphs journey. Intermediate or advanced users might not find many things to acquire from this course.
Damilare
June 24, 2023
Clearly explained, instructor speaks well. some videos could be shorter but generally worth the effort.
Markus
December 20, 2022
Nice info on graphs in Excel for students that have experience in excel, but not yet knowledge about graphs. For experienced excel users that want to improve their visuals, there is not so much benefit here as there is not so much attention on what to improve when visualizing but more on what format functions Excel offers.
Nur
November 10, 2022
It is good that you can plan your own timing to finish and you can forward and reverse anytime you need. It is quite draggy and you may lose interest halfway I would usually, stop for a break or start again the next day. slow and steady finish the race.
Presha
August 5, 2022
I felt the course quite complete in the sense of the step by step approach to the charts and functions. It is well explained and gave me insight on all the different type of charts. I had no issues with understanding the lecturer.
Maureencici
June 22, 2022
very detailed. but its a little difficult for me to understanding the tutor's speech. Makes me sleepy
Jason
June 1, 2022
Yes, this course was a good match for me. I had a hard time understanding some of the lecture because of the accent. Even the captioning did not match the dialog, but I was able to get enough out of the lessons to pass the quizzes and test. Thank you.
Riki
February 17, 2022
Very basic information about graphs. Shows how to create one, but does not go very deep. For beginners. If you need advanced, this is not the course.
K
December 9, 2021
Exactly what I needed: a straightforward, succinct overview of Excel's data visualization options so that I can jump in and explore the ones relevant to my work without struggling to find all the settings. The no-nonsense introduction to pivot charts and tables (surprisingly simple!) was an unexpected bonus. Excellent value.
Birat
November 27, 2021
Thankyou for providing this course specifically on visualization. my experience with the course was great. I would say I found the pacing a little off but that may be because of the accent. But, everything else was above from my expect specially the infographic part, I didn't expected that. Overall, I would say this is a great start if you want to learn more about graphs and plots.
Abosede
September 30, 2021
Yes this course is a good match for me in the sense that it is easy to comprehend. The categories of message that can be conveyed in section 5 is exceptionally useful for me.
Eva
August 25, 2021
Indisch-Englisch, aber gut zu verstehen. Einige interessante Anregungen zur gezielten Verwendung der Diagrammtypen aber bis auf eine Lektion nicht wirklich kreativ, eher eine Demonstration der xls Voreinstellungen. Ich hatte mir mehr versprochen, aber für andere mag der Kurs genau richtig sein, vor allem, wenn man noch nicht mit Diagrammen gearbeitet hat.
Parth
March 3, 2021
Dear Start academy, Thanks for wonderful lecture series. I know about the charts in excel but still I get some insightful information in series. Keep doing !

Charts

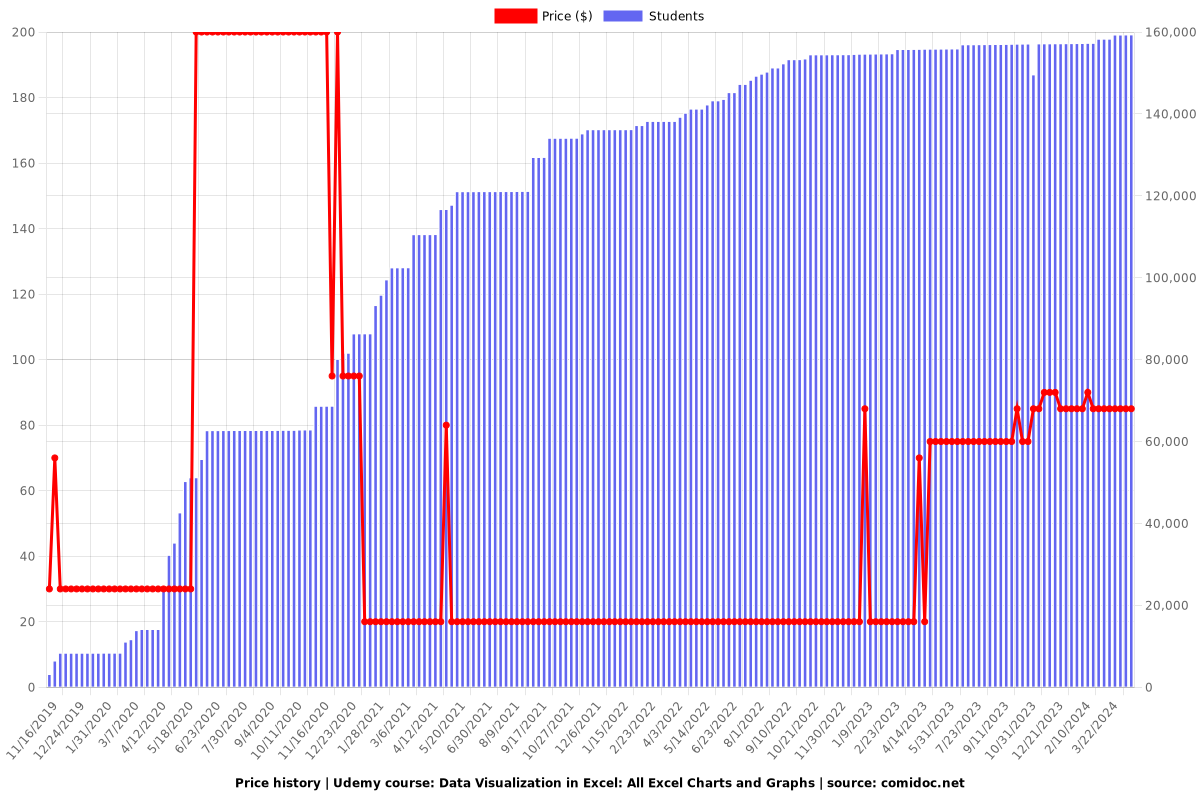
Price

Data Visualization in Excel: All Excel Charts and Graphs - Price chart

Rating

Data Visualization in Excel: All Excel Charts and Graphs - Ratings chart

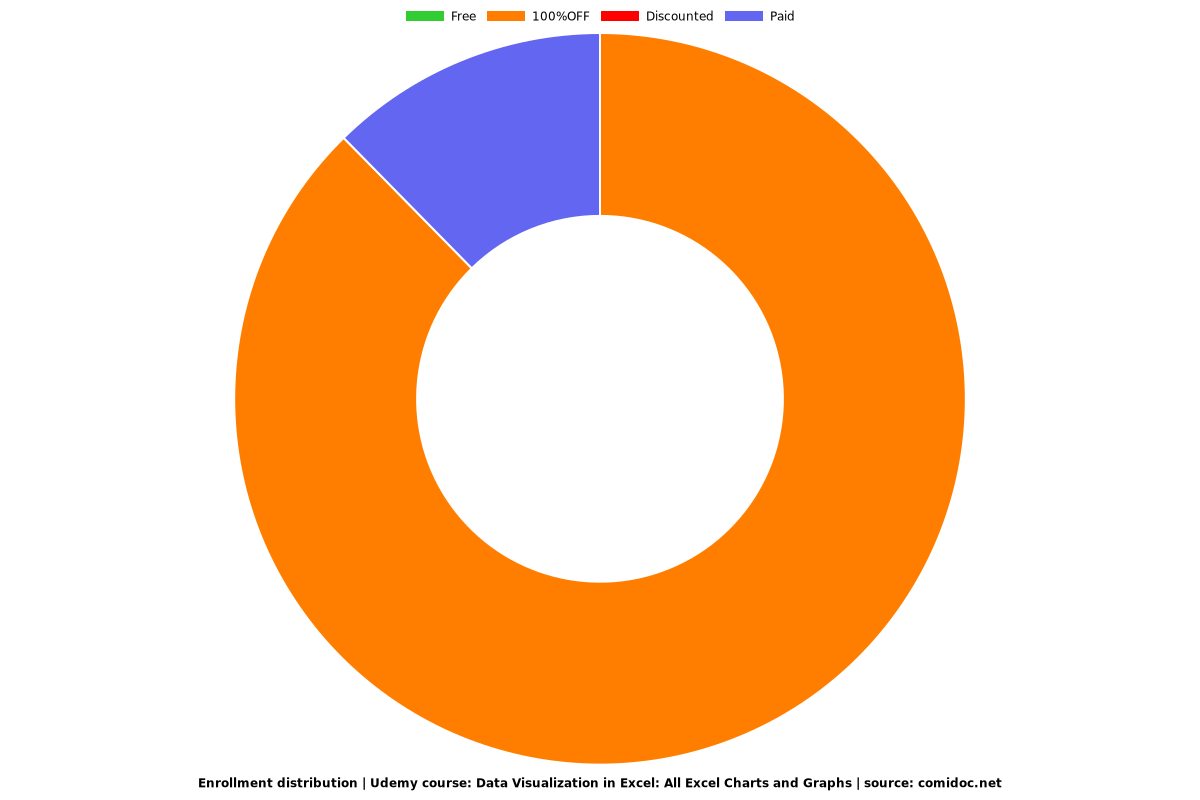
Enrollment distribution

Data Visualization in Excel: All Excel Charts and Graphs - Distribution chart
2312766
udemy ID
4/8/2019
course created date
11/16/2019
course indexed date
Bot
course submited by