Introduction to Data Science at the Middletown Bike Rally
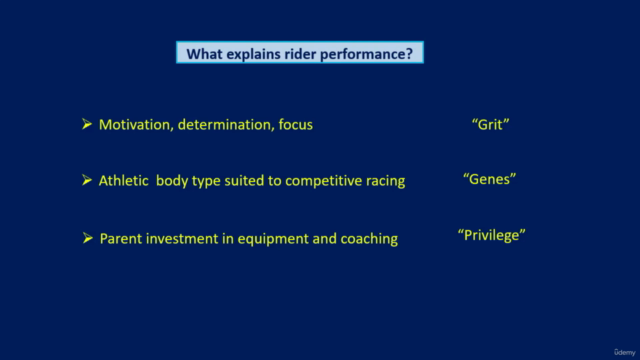
Grit, genes or privilege - which matters most?

193
students
1 hour
content
Dec 2023
last update
FREE
regular price
What you will learn
How correlation between variables is measured and interpreted..
How simple and multiple regression equations are estimated and interpreted
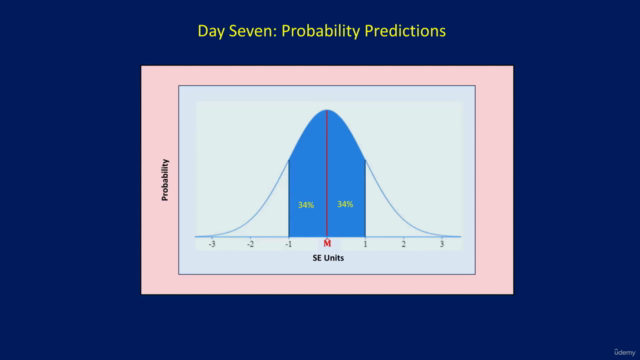
How and why multiple trials of a random variable are normally distributed
How probability distributions for random variables are constructed from regression equations
How probability distributions are used to predict outcomes for random variables
Why take this course?
🚀 **Introduction to Data Science at the Middletown Bike Rally**
---
### **Course Headline:** Grit, genes or privilege - which matters most?
---
🚴♂️ **Course Description:**
As a student in the 10th grade math class at Middletown High School, you're about to embark on an exciting journey into the world of data science. Last summer's Middletown Bike Rally has provided us with a unique opportunity to apply data science tools and techniques to understand what influences rider performance.
**Objective:** Use real-world data to analyze factors affecting biking performance, such as grit, genetic predisposition, and socioeconomic background (privilege).
**What You'll Learn:**
- **Data Collection & Preparation:** Construct a dataset using miles covered by each rider as the dependent variable. The independent variables include their grit score, gene score, and privilege score.
- **Correlation Analysis:** Learn how to calculate and interpret correlations between rider performance and the explanatory variables.
- **Simple Linear Regression:** Perform regressions using each of the explanatory variables to understand their individual impact on rider performance.
- **R-squared Values:** Discover how R-squared values quantify the percentage of variation in the dependent variable explained by the independent variable.
- **Multiple Linear Regression:** Explore the combined effect of grit, genes, and privilege on rider performance by using multiple regression analysis.
- **Prediction & Probability:** Use the regression equation to predict rider performance in next summer's rally and understand the role of randomness and probability distributions.
- **Normal Distributions:** Analyze frequency distributions and their relationship to normal (Gaussian) distributions, particularly in the context of repeated trials of a random variable.
- **Probability Models:** Build a normal probability distribution for a rider's performance next summer based on the mean and standard error from the multiple regression equation.
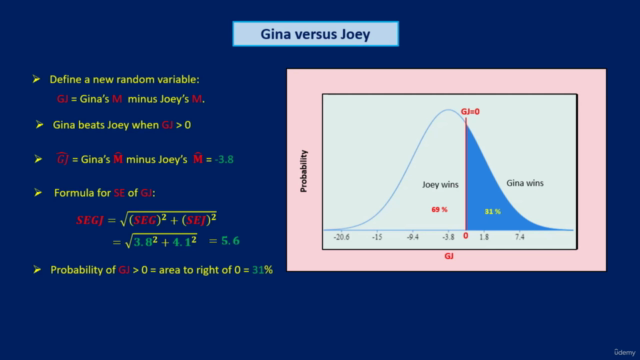
- **Odds & Outcomes:** Calculate the odds of various outcomes in the upcoming rally, such as comparing Gina's predicted performance to her brother Joey's.
**Why Take This Course?**
This course is not just about understanding data science tools; it's about applying them to real-world scenarios. You'll learn how to approach complex problems using a scientific mindset and data-driven decision-making. Plus, you'll gain insights into the nature/nurture debate through a data lens, questioning which factors truly influence our capabilities and outcomes.
Join us for an enlightening exploration of data science at the Middletown Bike Rally, where your curiosity and analytical skills will be put to the test in a fun, engaging environment. Let's decode the mystery behind biking performance – is it grit, genes, or privilege? Enroll now to find out! 🎓🚲
---
**Instructor:** Daniel Badger Jr.
Daniel brings a wealth of knowledge in data science and statistics to the course, with a passion for making complex concepts accessible and enjoyable for students. With years of experience in both academic and industry settings, he is excited to guide you through this data-driven adventure.
Screenshots


5694246
udemy ID
12/5/2023
course created date
1/6/2024
course indexed date
Bot
course submited by