Data Analysis & Visualization: Python | Excel | BI | Tableau
Connect to data, clean & transform data, analyse and visualize data.

What you will learn
Connect to Kaggle Datasets
Explore Pandas DataFrame
Analyse and manipulate Pandas DataFrame
Data cleaning with Python
Data Visualization with Python
Connect to web data with Power BI
Clean and transform web data with Power BI
Create data visualization with Power BI
Publish reports to Power BI Service
Transform less structured data with Power BI
Connect to data source with excel
Prep query with excel Power query
Data cleaning with excel
Create data model and build relationships
Create lookups with DAX
Analyse data with Pivot Tables
Analyse data with Pivot Charts
Connect to data sources with Tableau
Join related data and create relationships with Tableau
Data Cleaning with Tableau
Data analysis with Tableau
Data visualization with Tableau
Why take this course?
As a data analyst, you are on a journey. Think about all the data that is being generated each day and that is available in an organization, from transactional data in a traditional database, telemetry data from services that you use, to signals that you get from different areas like social media.
For example, today's retail businesses collect and store massive amounts of data that track the items you browsed and purchased, the pages you've visited on their site, the aisles you purchase products from, your spending habits, and much more.
With data and information as the most strategic asset of a business, the underlying challenge that organizations have today is understanding and using their data to positively effect change within the business. Businesses continue to struggle to use their data in a meaningful and productive way, which impacts their ability to act.
The key to unlocking this data is being able to tell a story with it. In today's highly competitive and fast-paced business world, crafting reports that tell that story is what helps business leaders take action on the data. Business decision makers depend on an accurate story to drive better business decisions. The faster a business can make precise decisions, the more competitive they will be and the better advantage they will have. Without the story, it is difficult to understand what the data is trying to tell you.
However, having data alone is not enough. You need to be able to act on the data to effect change within the business. That action could involve reallocating resources within the business to accommodate a need, or it could be identifying a failing campaign and knowing when to change course. These situations are where telling a story with your data is important.
Python is a popular programming language.
It is used for:
web development (server-side),
software development,
mathematics,
Data Analysis
Data Visualization
System scripting.
Python can be used for data analysis and visualization.
Data analysis is the process of analysing, interpreting, data to discover valuable insights that drive smarter and more effective business decisions.
Data analysis tools are used to extract useful information from business and other types of data, and help make the data analysis process easier.
Data visualisation is the graphical representation of information and data.
By using visual elements like charts, graphs and maps, data visualisation tools
provide an accessible way to see and understand trends, outliers and patterns in data.
The Jupyter Notebook is an open-source web application that allows you to create and share documents that contain live code, equations, visualizations and narrative text. Uses include: data cleaning and transformation, numerical simulation, statistical modelling, data visualization, machine learning, and much more.
Power BI is a collection of software services, apps, and connectors that work together to turn your unrelated sources of data into coherent, visually immersive, and interactive insights. Your data may be an Excel spreadsheet, or a collection of cloud-based and on-premises hybrid data warehouses. Power BI lets you easily connect to your data sources, visualize and discover what's important, and share that with anyone or everyone you want.
Power BI consists of several elements that all work together, starting with these three basics:
A Windows desktop application called Power BI Desktop.
An online SaaS (Software as a Service) service called the Power BI service.
Power BI mobile apps for Windows, iOS, and Android devices.
These three elements—Power BI Desktop, the service, and the mobile apps—are designed to let you create, share, and consume business insights in the way that serves you and your role most effectively.
Beyond those three, Power BI also features two other elements:
Power BI Report Builder, for creating paginated reports to share in the Power BI service. Read more about paginated reports later in this article.
Power BI Report Server, an on-premises report server where you can publish your Power BI reports, after creating them in Power BI Desktop.
Tableau is a widely used business intelligence (BI) and analytics software trusted by companies like Amazon, Experian, and Unilever to explore, visualize, and securely share data in the form of Workbooks and Dashboards. With its user-friendly drag-and-drop functionality it can be used by everyone to quickly clean, analyze, and visualize your team’s data. You’ll learn how to navigate Tableau’s interface and connect and present data using easy-to-understand visualizations. By the end of this training, you’ll have the skills you need to confidently explore Tableau and build impactful data dashboards.
Reviews
Charts
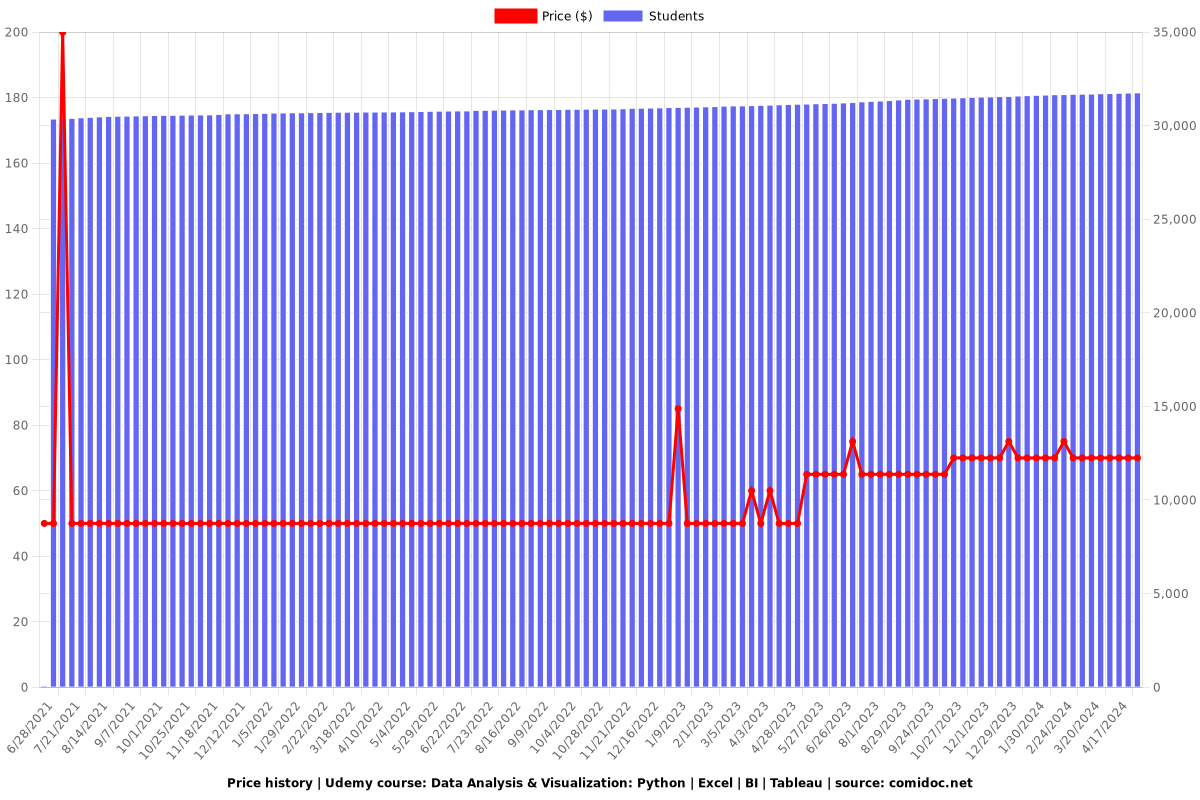
Price

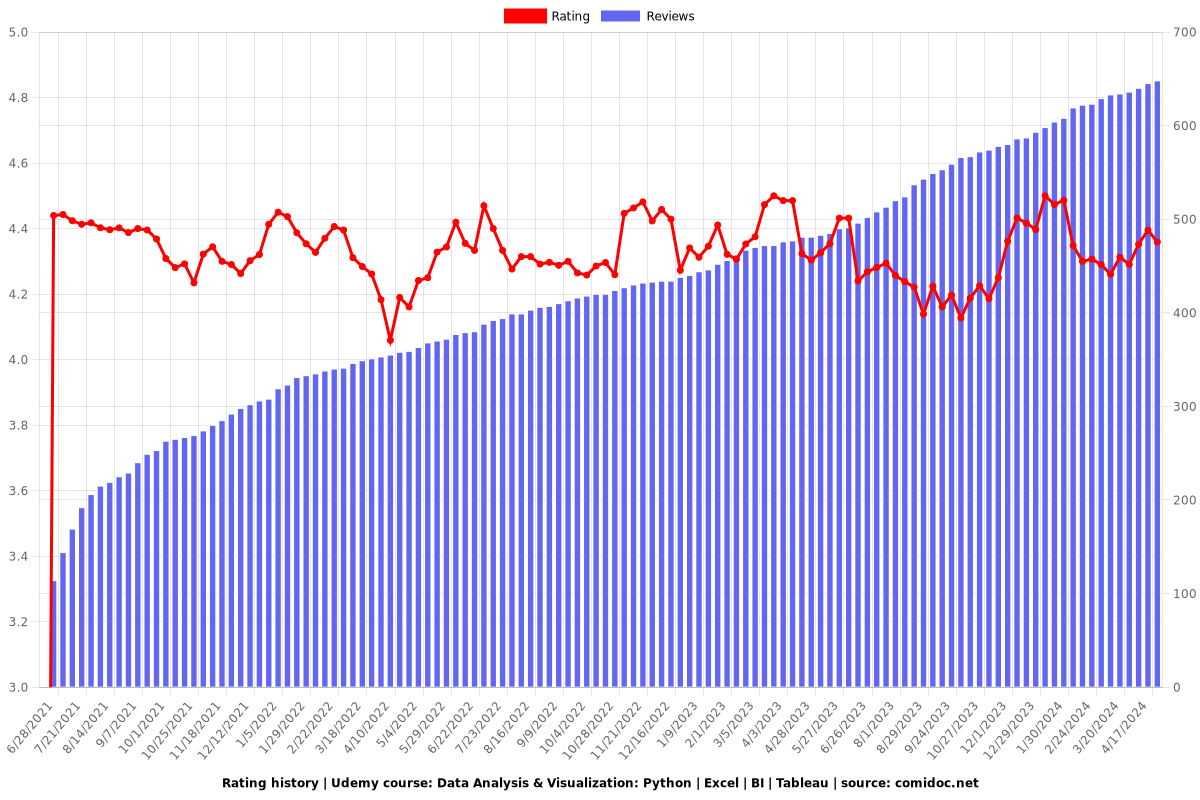
Rating

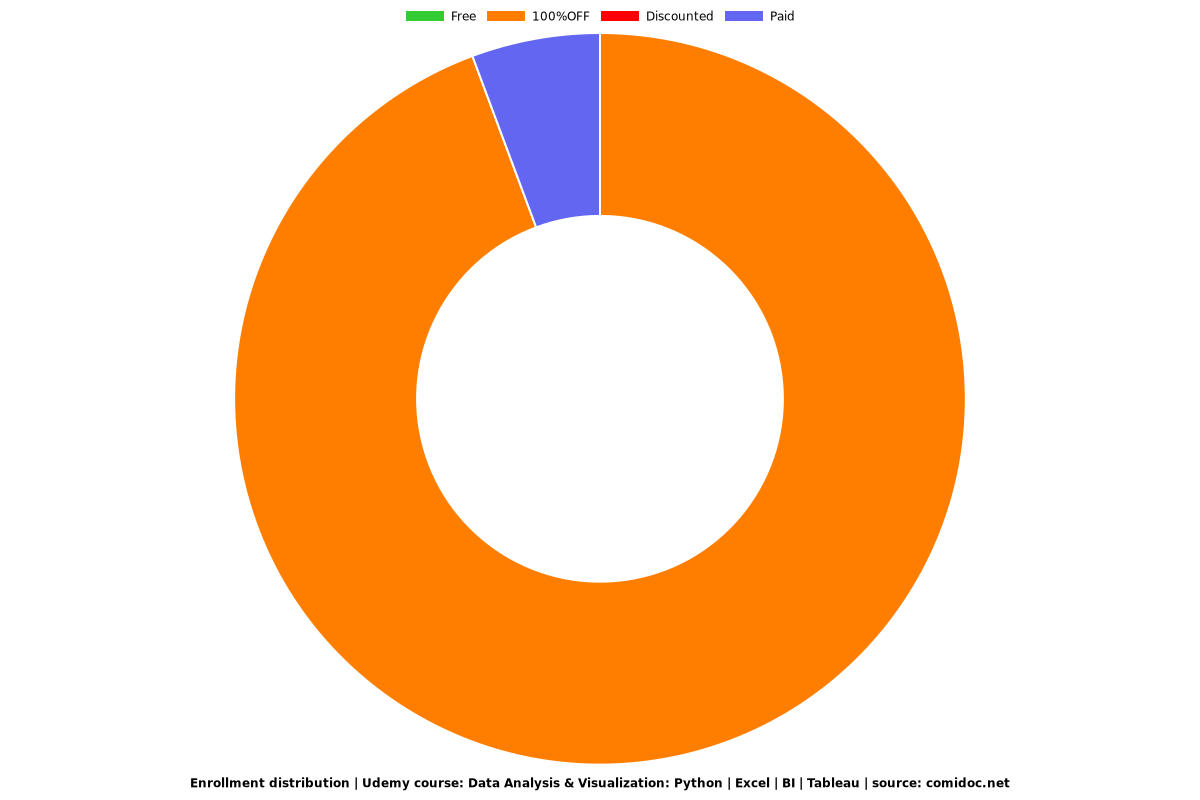
Enrollment distribution
