Title
A Complete Guide to Power BI Dashboard for Projects
A Comprehensive Video Tutorial Series on Creation of a Dashboard to Evaluate Projects' Performance

What you will learn
Gain insights into project performance through the utilization of animations as a powerful tool for measurement and evaluation.
Enhance project planning and decision-making by effectively predicting the projected completion dates and total costs of a project.
Reshape and Transform Data in Power Query Editor
Efficiently restructure and modify data using the Power Query Editor for enhanced data analysis and visualization.
Develop comprehensive interactive dashboards with dynamic visuals and analytical tools to effectively assess and analyze project performance.
Understand and determine critical parameters to assess and forecast a project
Why take this course?
🎓 A Complete Guide to Power BI Dashboard for Projects 📊
Course Headline: A Comprehensive Video Tutorial Series on Creation of a Dashboard to Evaluate Projects' Performance
Course Description:
🚀 Transform Your Reporting Skills with Power BI!
Are you ready to unlock the power of project management and take your reporting skills to the next level? In today's fast-paced world, it's crucial to quickly identify the key components of a project at any given time. That's where interactive dashboards come in—they provide real-time insights and allow you to dive deep into the details while remaining user-friendly and easy to maintain.
🔥 Master Power BI Dashboards
In this exciting course, we will dive into the world of Power BI, one of the most powerful tools available for creating interactive dashboards. Not only will you learn how to build a complete Power BI dashboard from start to finish, but you will also gain a solid understanding of how to measure a project's performance.
🔍 Eliminate the Complexity
Say goodbye to confusion! We will guide you through data transformation using Power Query Editor and demystify Power BI measures with engaging animations. You'll gain a clear understanding of how to use these tools effectively, enabling you to build dynamic dashboards with different data sources and analytical capabilities.
🎨 Creativity Meets Data
Get ready to unleash your creativity and become a master of project reporting. By the end of this course, you will have the skills and confidence to create stunning dashboards that impress stakeholders and provide valuable insights. Don't miss out on this opportunity to level up your project management skills with Power BI and Power Query!
What You'll Learn:
- Data Transformation Techniques: Learn how to clean, shape, and blend data using Power Query Editor.
- Creating Intuitive Reports: Develop interactive reports that can be easily understood by stakeholders.
- Understanding Measures & Calculated Columns: Master the art of creating complex measures and calculated columns with ease.
- Building Interactive Visualizations: Create visualizations that are not only aesthetically pleasing but also interactive.
- Dashboard Customization: Personalize your dashboards to cater to the specific needs of your projects.
- Performance Monitoring: Implement key performance indicators (KPIs) to monitor project performance effectively.
- Real-time Data Analysis: Utilize Power BI's powerful analytical features to gain real-time insights into project metrics.
Why Choose This Course?
- Expert Instruction: Led by Samitha Prasannac, an expert in Power BI and data analytics.
- Hands-On Learning: Engage with practical exercises that apply theoretical knowledge to real-world scenarios.
- Flexible Learning: Access the course materials at your convenience, learn at your own pace, and revisit content as needed.
- Community Support: Join a community of learners and professionals who are also on their journey to mastering Power BI.
🏆 Elevate Your Career
By completing this course, you will be equipped with the skills to not only manage projects effectively but also to present data in a way that enhances decision-making and project success. Take the first step towards becoming a data analytics expert today!
Enroll now and embark on your journey to mastering Power BI for project management. Let's turn complex data into compelling stories with this comprehensive course tailored for professionals like you! 🌟
Screenshots


Reviews
Charts
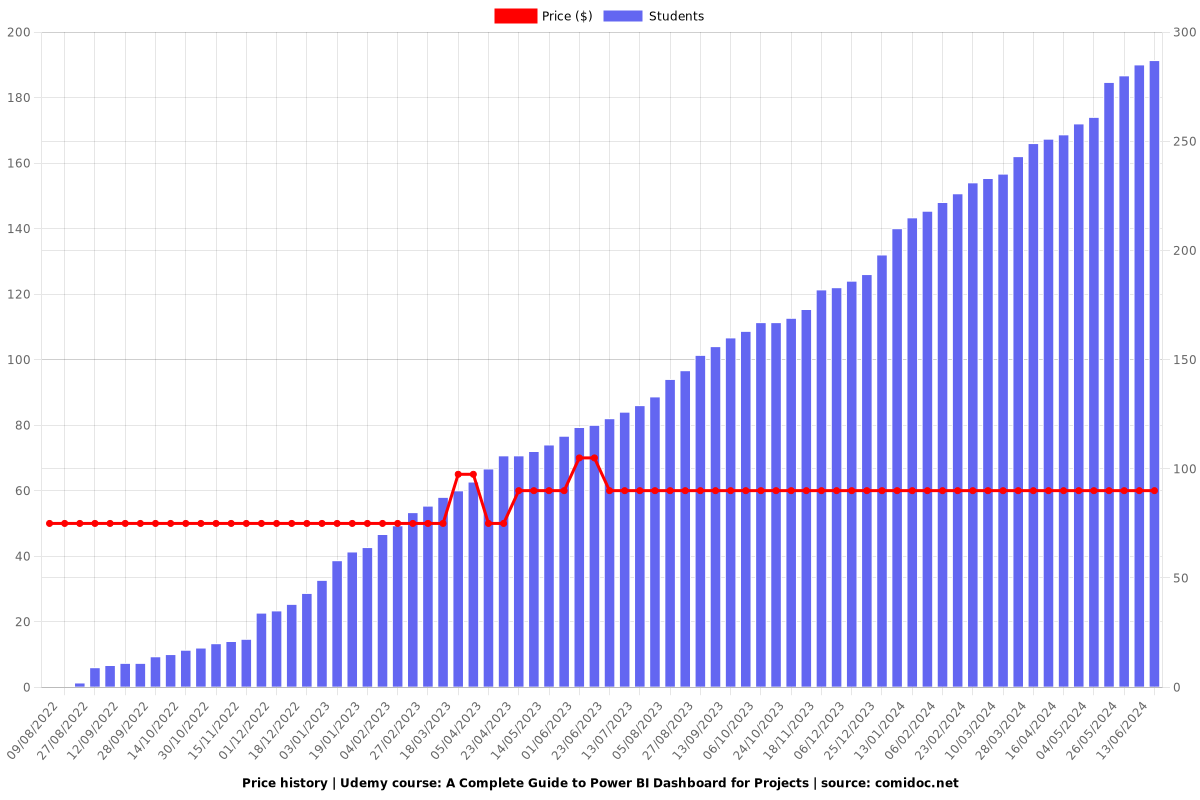
Price
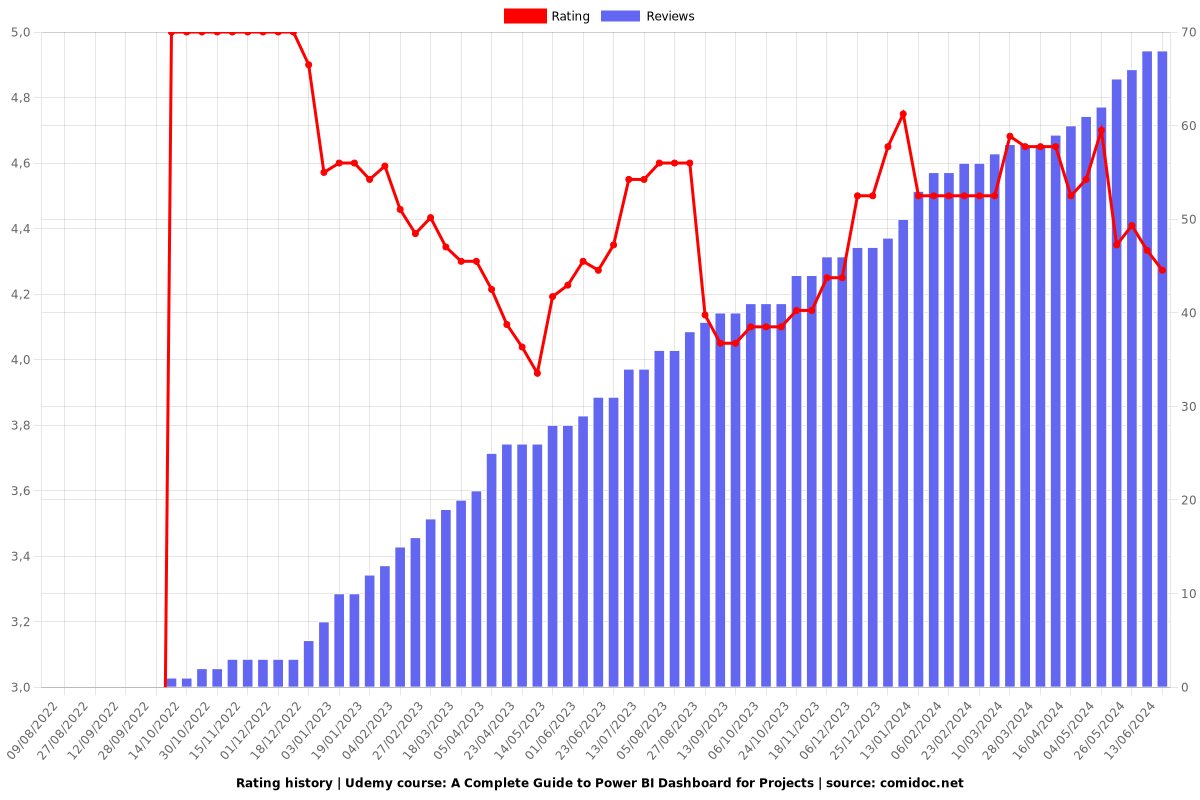
Rating
Enrollment distribution