Cloud Monitoring with Grafana Dashboard and Prometheus Part1
How to Monitor Servers VPS Cloud with Grafana Dashboard and Prometheus - Network/System Administration and Monitoring P1
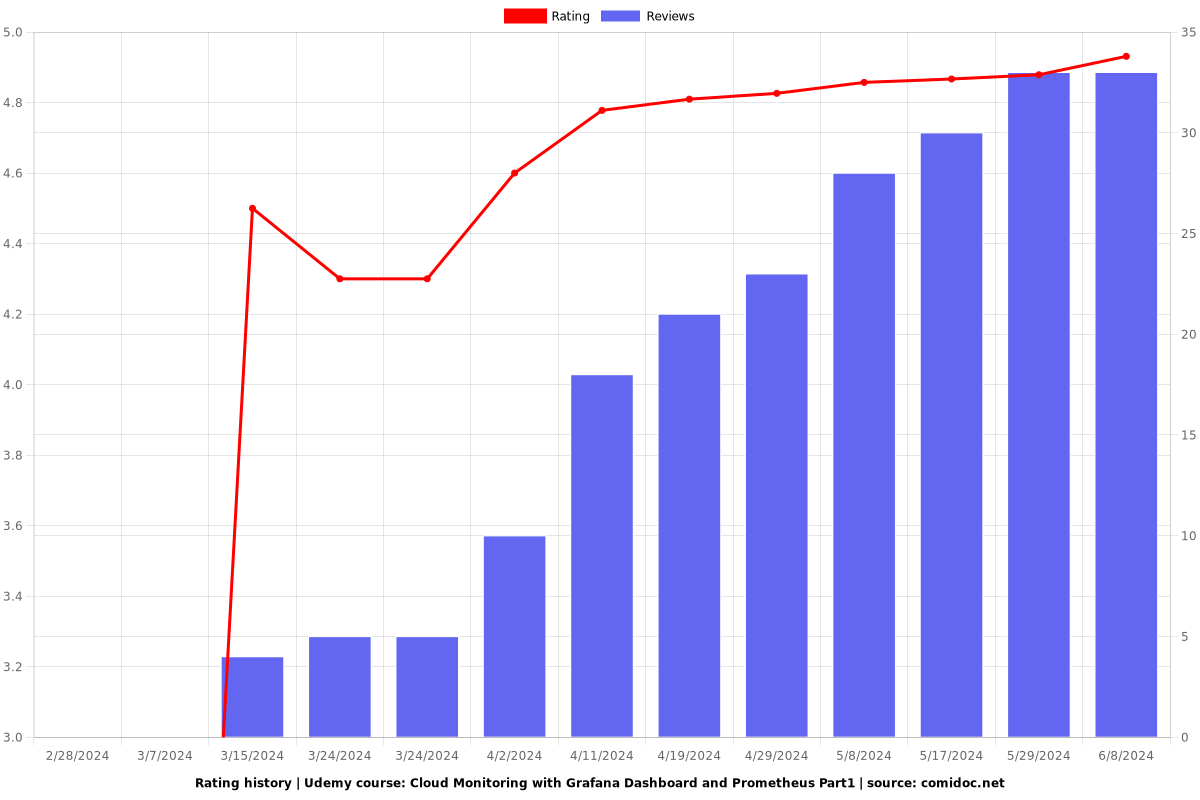
4.86 (28 reviews)

548
students
1 hour
content
Feb 2024
last update
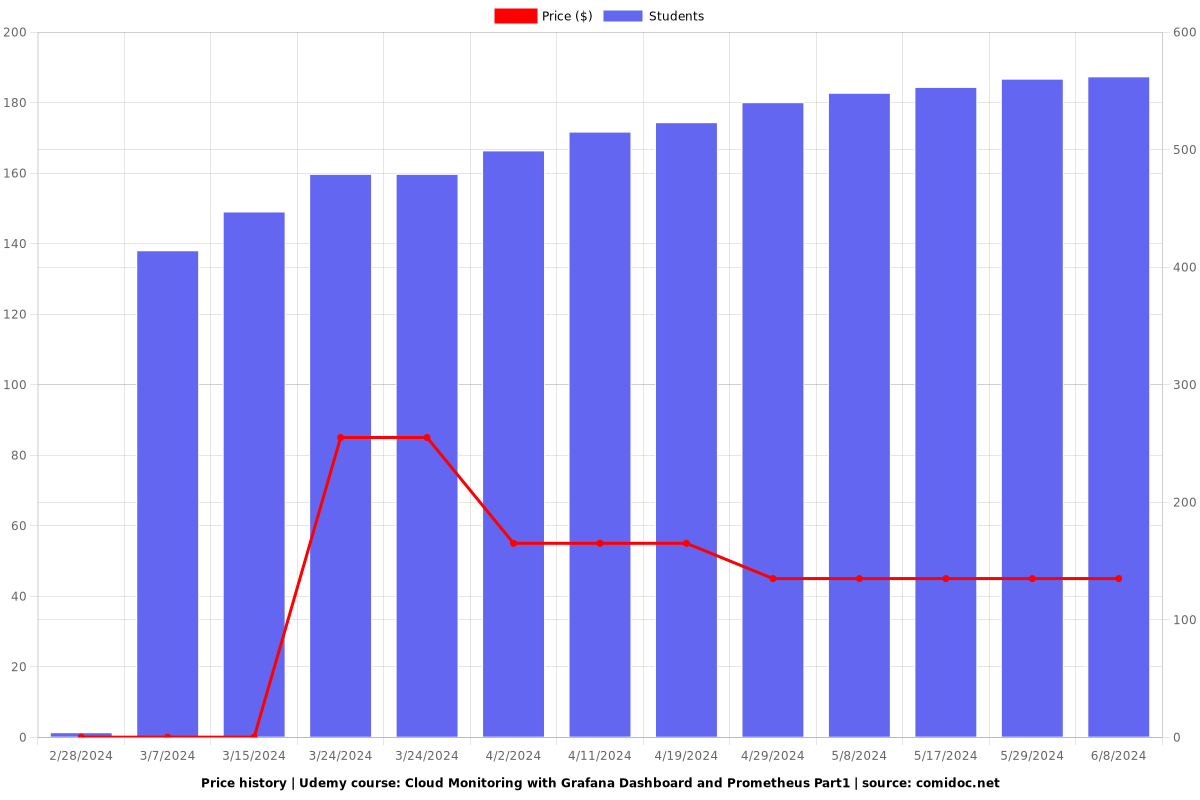
$44.99
regular price
What you will learn
Cloud Monitoring
Grafana Dashboard
Prometheus
Server and VPN Monitoring
Grafana Installation
Prometheus Installation and Configuration
Why take this course?
---
**How to Monitor Servers, VPS & Cloud with **[**Grafana Dashboard**](#)** & **[**Prometheus**](#)** - Network/System Administration and Monitoring P1** 🚀
**Course Instructor:** Adrian Fischercourse title: "Cloud Monitoring with Grafana Dashboard and Prometheus Part1"course headline: **Master Cloud Monitoring for Optimal Performance and Reliability! 🌩️**
---
**Course Description:**
Embark on a journey to master cloud monitoring by leveraging the powerful combination of Grafana Dashboard and Prometheus. This course is your ticket to becoming a proficient cloud monitor, equipped with the skills to ensure high performance and reliability within your IT infrastructure. 🛠️💻
**What You Will Learn:**
- **Foundation of Cloud Monitoring:** Understand its significance in modern IT and the challenges it addresses.
- **Grafana & Prometheus Deep Dive:** Gain insight into the architecture, features, and capabilities of both tools.
- **Hands-On Installation & Configuration:** Learn how to set up Grafana and Prometheus through practical exercises.
- **Customizing Grafana Dashboards:** Discover how to create and personalize dashboards that visualize your data effectively.
- **Real-World Application:** Engage with scenarios that apply what you've learned to real-world situations for optimal performance.
**Why Monitor with Grafana & Prometheus?** 🤔🔍
- **Grafana's User-Friendly Interface:** Create customizable dashboards that bring clarity to complex data sets.
- **Prometheus' Scalable Data Storage:** Reliably store and collect time-series data for dynamic cloud environments.
- **Seamless Integration:** Easily integrate with existing monitoring systems, minimizing disruption.
- **Extensive Plugins & Integrations:** Tailor Grafana to fit your unique monitoring needs.
- **Advanced Querying:** Gain deep insights and make informed decisions swiftly.
- **Proactive Alerting:** Set up robust alerting systems to stay ahead of potential issues.
**Course Highlights:**
- **Comprehensive Course Content:** From the basics to advanced techniques, cover everything you need to know about cloud monitoring.
- **Expert Guidance:** Learn from Adrian Fischerc, a seasoned professional with real-world expertise in network and system administration.
- **Interactive Learning Experience:** Engage with the material through practical exercises that reinforce learning.
- **Real-World Examples:** Apply your newfound knowledge to actual use cases for better understanding and skill retention.
**By the end of this course, you will be able to:**
- Design, implement, and maintain monitoring systems using Grafana Dashboard & Prometheus Server.
- Troubleshoot and optimize cloud infrastructure with actionable insights provided by your custom dashboards.
- Ensure high availability, reliability, and performance of your servers, VPS, and cloud services through effective monitoring.
**Ready to transform your IT operations? 🌟 Enroll in "Cloud Monitoring with Grafana Dashboard and Prometheus Part1" today and take the first step towards a more efficient, robust, and scalable cloud infrastructure!**
---
**Key Takeaways:**
- **Understand Cloud Monitoring Importance:** Learn why it's crucial for modern IT infrastructures.
- **Gain Mastery Over Grafana & Prometheus:** Become an expert in these industry-leading monitoring tools.
- **Practical Experience:** Apply your skills through hands-on exercises.
- **Tailor Your Monitoring Solution:** Use Grafana's plugins and integrations to customize your monitoring setup.
- **Ensure High Availability & Performance:** Keep your cloud infrastructure running smoothly with proactive monitoring.
**Don't miss out! Join us on this insightful journey and become a Cloud Monitoring Hero with Grafana Dashboard & Prometheus Server today! 🏆**
---
**Enroll Now to Secure Your Spot in the Course!** 🎓💫
---
Screenshots


Charts
Price
Rating
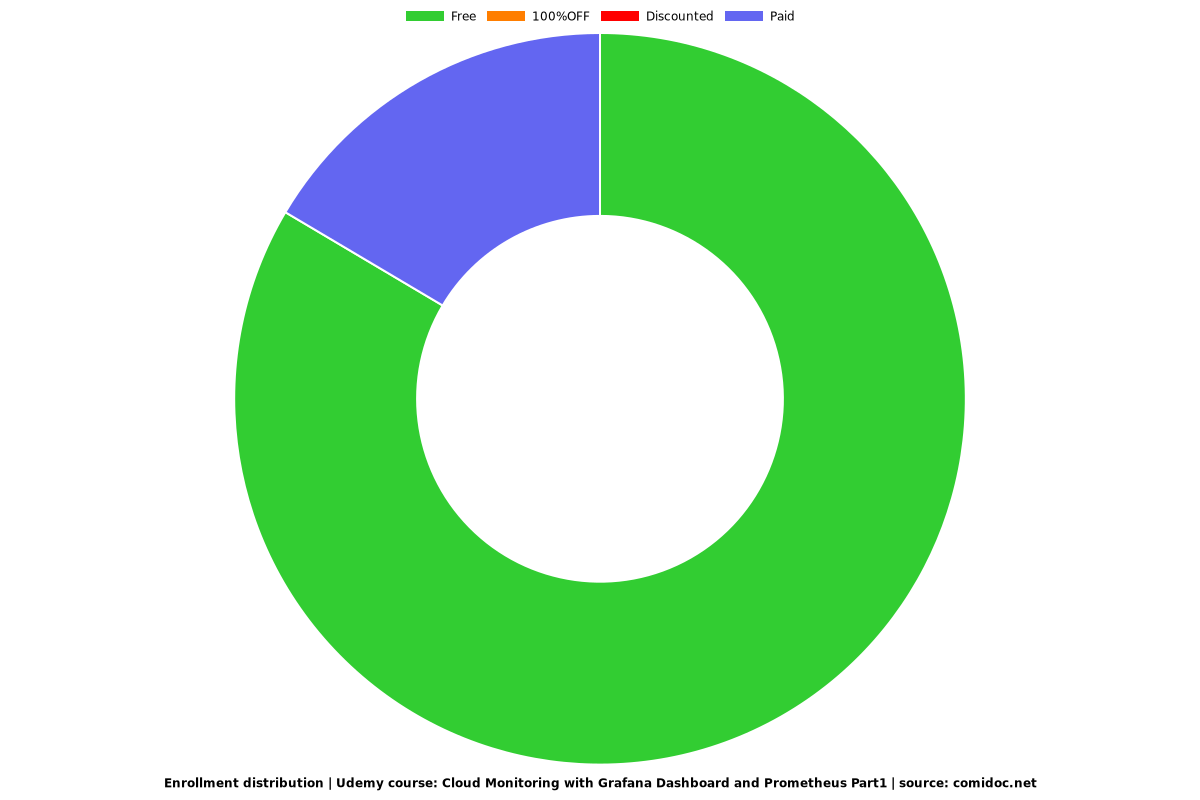
Enrollment distribution
5840910
udemy ID
2/25/2024
course created date
2/28/2024
course indexed date
Bot
course submited by