Building Reports with SQL Server Reporting Services (SSRS)
This course shows the buidling of a tabular and a diagram report from scratch. Advanced topics are covered too.
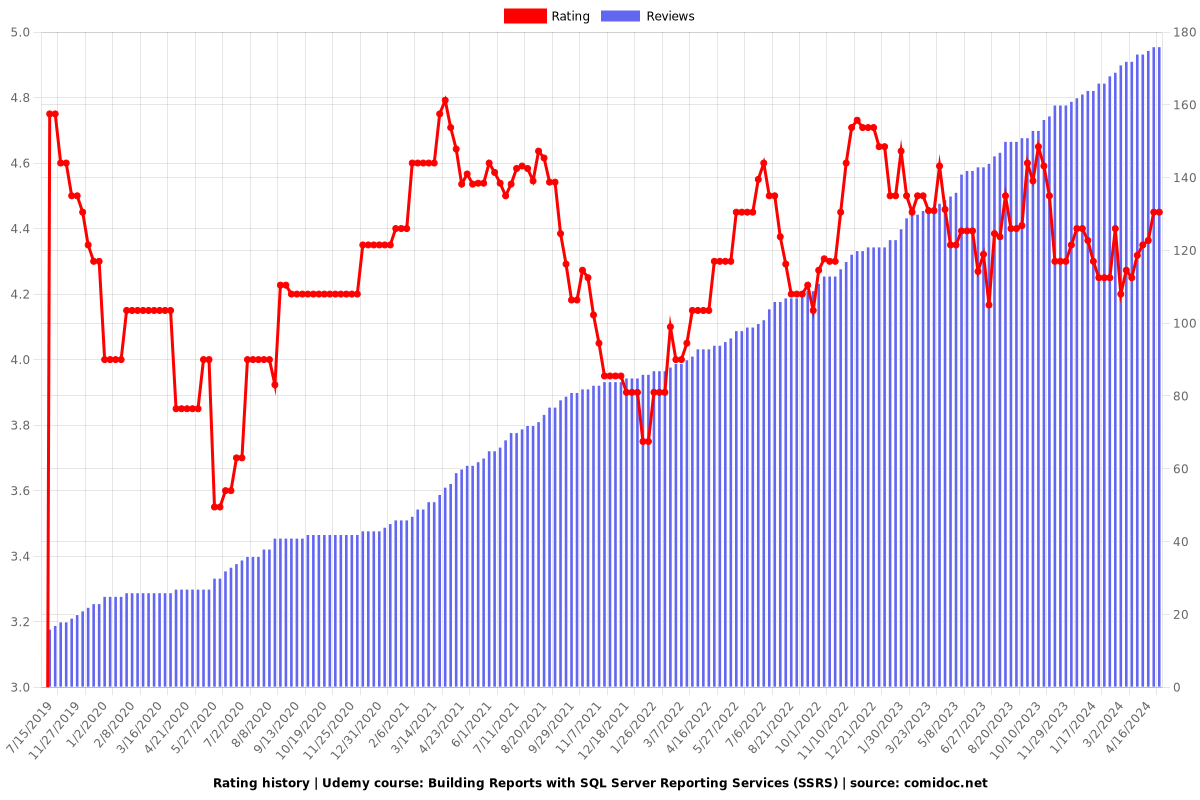
4.36 (175 reviews)

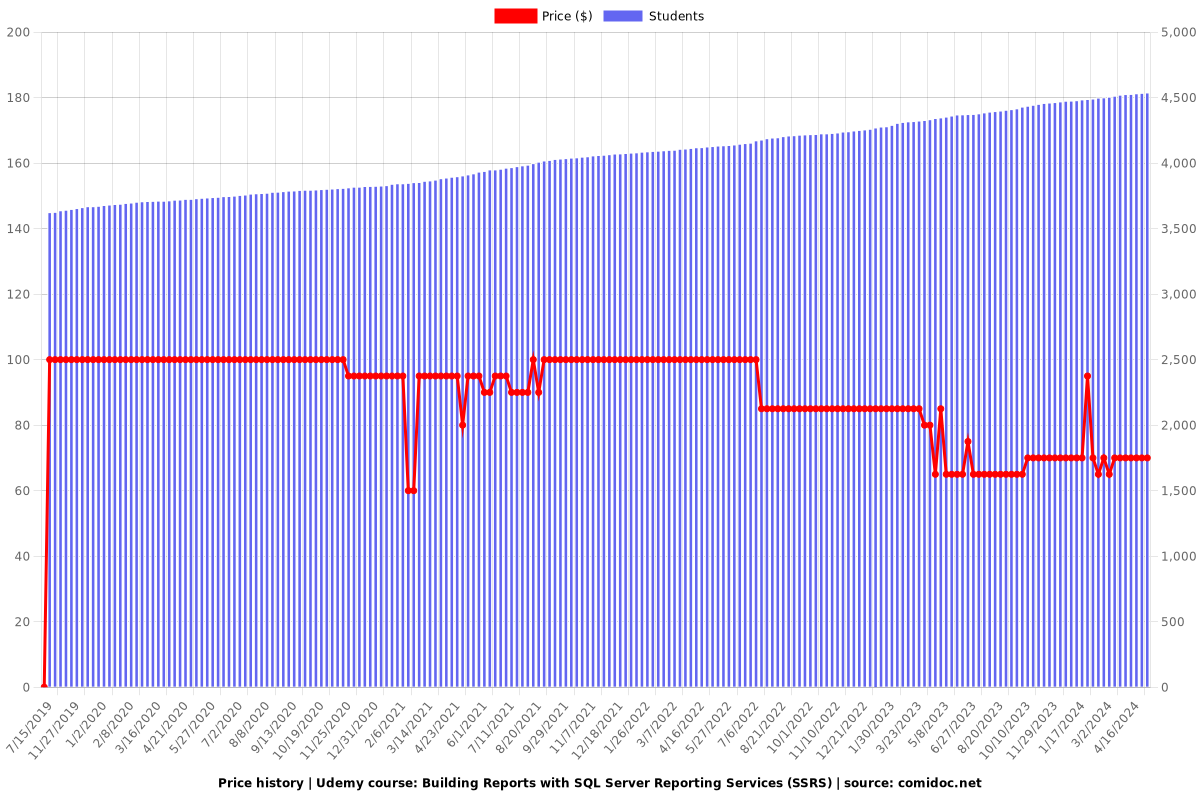
4,530
students
4 hours
content
Mar 2020
last update
$69.99
regular price
What you will learn
In this course we will develop a tabluar and a diagram report from scratch. We will be using grouping, attach parameter to datasets, include sorting, set a print layout and apply some expressions.
Additionally you get some advanced tips and tricks.
In the last chapter we cover the report server and how to deploy our reports.
To get started, we install the development environment together wth the Visual Studio and the Data Tools. Additionally we need a SQL Server and a Report Server.
At some points we will develop strategies to overcome some limitations of Reporting Services. Mainly we will create a work around for limited sorting functionalities.
Why take this course?
🚀 **Master the Art of Reporting with SSRS!** 📊
**Course Title:** Building Reports with SQL Server Reporting Services (SSRS)
**Course Headline:** Dive into Data Visualization – From Scratch to Advanced Reporting with SSRS
---
**Unlock the Power of Data Reporting with SSRS!**
Are you ready to transform raw data into compelling reports that can influence decision-making? Our comprehensive course, **Building Reports with SQL Server Reporting Services (SSRS)**, is designed for both novice and seasoned professionals who want to master the art of creating powerful and informative reports. With hands-on learning experiences, you'll build a solid foundation in SSRS, from creating tabular reports to designing diagrammatic visualizations.
📈 **Course Overview:**
- **Essential Basics:** Learn the groundwork of SSRS and how it fits into the Microsoft BI ecosystem. Discover how to create a report using shared data sources, datasets, and simple matrices or tables.
- **Intermediate Techniques:** Explore advanced features such as parameters, grouping, drill-through capabilities, and custom code expressions.
- **Advanced Topics:** Delve into best practices, performance considerations, security aspects, and more.
- **Real-World Application:** Put your skills to the test by creating complex reports, including a diagrammatic report, in our final project.
---
**What You'll Learn:**
- **Datasource Creation:** Define and manage datasources for your reports with ease.
- **Report Development:** Learn to build from simple tabular reports to sophisticated diagram reports.
- **Deployment Processes:** Understand how to deploy your reports to a Report Server, ensuring they are accessible by the intended audience.
- **Best Practices:** Utilize industry-standard practices and workarounds for common issues you'll encounter in report design.
- **Troubleshooting Tips:** Learn how to diagnose and resolve typical problems encountered when working with SSRS.
---
**Course Breakdown:**
1. **Introduction to SQL Server Reporting Services (SSRS):** Get an overview of what SSRS is, its capabilities, and its place in the BI stack.
2. **Setting Up Your Development Environment:** Configure your tools for a smooth development experience.
3. **Creating a Datasource:** Learn how to create and manage datasources for reliable data retrieval.
4. **Building Your First Report:** Start by creating a basic table or matrix report from live data.
5. **Adding Parameters and Grouping:** Make your reports more dynamic and user-friendly with parameters and grouping features.
6. **Advanced Report Features:** Dive into advanced topics such as charting, custom code expressions, and security.
7. **Creating a Diagrammatic Report:** Visualize data in a compelling way to tell a story.
8. **Final Project – The Complete Workflow:** Apply everything you've learned to create a comprehensive report from scratch, including a detailed diagrammatic report.
9. **Course Wrap-Up and Additional Resources:** Get the final project file for reference and explore additional resources for continued learning.
---
**Who Should Take This Course?**
- Business Intelligence Developers
- Data Analysts
- Database Administrators
- IT Professionals interested in reporting
- Anyone looking to enhance their data presentation and visualization skills
By the end of this course, you'll have the tools and knowledge to create powerful reports that provide actionable insights. Whether you're aiming for a career in business intelligence or simply trying to improve your current reporting capabilities, **Building Reports with SQL Server Reporting Services (SSRS)** is the perfect place to start.
🎓 Enroll now and take your data reporting skills to the next level with SSRS! 🎓
Screenshots


Our review
🌟 **Overall Course Review**
**Rating:** 4.35/5
**Pros:**
- **Detailed Explanation:** The course is praised for its step-by-step approach, which is particularly helpful for beginners or those who are not familiar with the tool. It covers everything from installation to usage of elements, making it comprehensive for new users.
- **Practical Utility:** Users find the course very useful for practical, hands-on application and learning.
- **Coverage:** The content is considered to be informative and broad in scope, providing a quick recap for those with prior knowledge.
- **Helpful for Learning:** The course is recommended by users who have gained skills and knowledge that helped them get up and running quickly with the tool.
**Cons:**
- **Pacing for Experienced Users:** Some users feel that the first module may be too detailed or tedious for those with prior experience.
- **Audio Quality Issues:** A recurring issue across multiple reviews is the low volume of the audio in the course, making it difficult to hear and understand at times, especially when considering accents and without the ability to increase volume during recording.
- **Technical Difficulties:** There is a mention of an installation guide that was not for SSRS but for VS Code SSRS, which could be confusing and time-consuming for learners.
- **Content Presentation:** The trainer's voice is described as too low in confidence, and some users suggest improvements such as adding more quizzes, increasing the volume of recordings, and checking video/audio content before publication to ensure quality.
- **Accessibility:** One user notes the need for better audio quality to accommodate those who rely on hearing the material or have difficulty with accents.
**Additional Feedback:**
- **User Interaction:** Users express a desire for more interaction and confidence from the trainer during practical sessions.
- **Quizzes and Assignments:** Some users recommend adding more quizzes throughout the course to enhance learning and retention of the material.
- **Pre-Publication Checks:** A suggestion is made for improved pre-publication checks for video and audio content to avoid issues like low volume and poor quality sound.
**Recommendations for Improvement:**
- **Technical Clarifications:** Ensure that the course content accurately reflects the tool it purports to teach (SSRS).
- **Audio Recording:** Improve the recording quality of the instructor's voice to ensure clarity and accessibility.
- **Content Review:** Implement a thorough review process for all video and audio content before publication.
- **Interactive Elements:** Add more interactive elements, such as quizzes and assignments, to reinforce learning.
- **User Experience:** Address any issues that may make the course less accessible or engaging for learners.
**Final Verdict:** The course is a valuable resource for beginners looking to learn about SSRS, with some areas for improvement in terms of audio quality and technical accuracy. With enhancements made in these areas, the course could provide an even more enriching learning experience.
Charts
Price
Rating
Enrollment distribution

Related Topics
2456342
udemy ID
7/12/2019
course created date
7/15/2019
course indexed date
Bot
course submited by