Big Data Analytics with PySpark + Tableau Desktop + MongoDB
Integrating Big Data Processing tools with Predictive Modeling and Visualization with Tableau Desktop

What you will learn
Tableau Data Visualization
PySpark Programming
Data Analysis
Data Transformation and Manipulation
Big Data Machine Learning
Geo Mapping with Tableau
Geospatial Machine Learning
Creating Dashboards
Why take this course?
Welcome to the Big Data Analytics with PySpark + Tableau Desktop + MongoDB course. In this course we will be creating a big data analytics solution using big data technologies like PySpark for ETL, MLlib for Machine Learning as well as Tableau for Data Visualization and for building Dashboards.
We will be working with earthquake data, that we will transform into summary tables. We will then use these tables to train predictive models and predict future earthquakes. We will then analyze the data by building reports and dashboards in Tableau Desktop.
Tableau Desktop is a powerful data visualization tool used for big data analysis and visualization. It allows for data blending, real-time analysis and collaboration of data. No programming is needed for Tableau Desktop, which makes it a very easy and powerful tool to create dashboards apps and reports.
MongoDB is a document-oriented NoSQL database, used for high volume data storage. It stores data in JSON like format called documents, and does not use row/column tables. The document model maps to the objects in your application code, making the data easy to work with.
You will learn how to create data processing pipelines using PySpark
You will learn machine learning with geospatial data using the Spark MLlib library
You will learn data analysis using PySpark, MongoDB and Tableau
You will learn how to manipulate, clean and transform data using PySpark dataframes
You will learn how to create Geo Maps in Tableau Desktop
You will also learn how to create dashboards in Tableau Desktop
Screenshots


Reviews
Charts
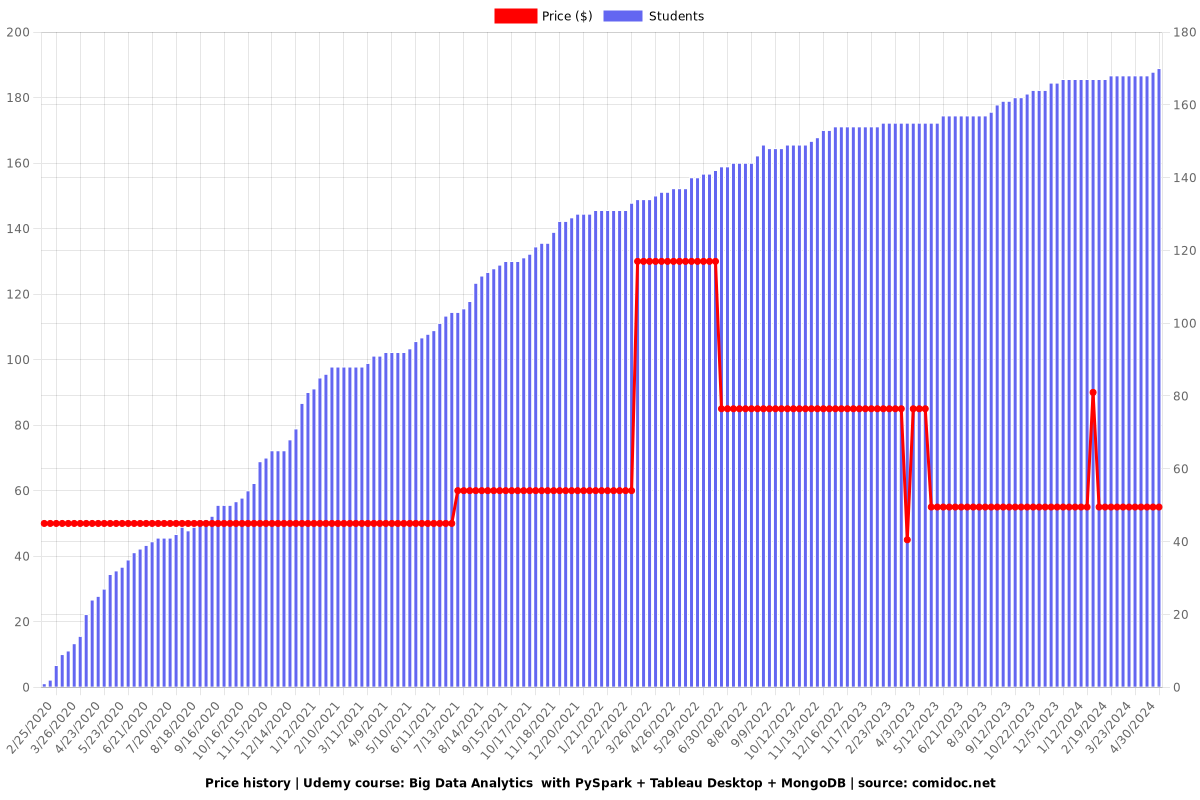
Price
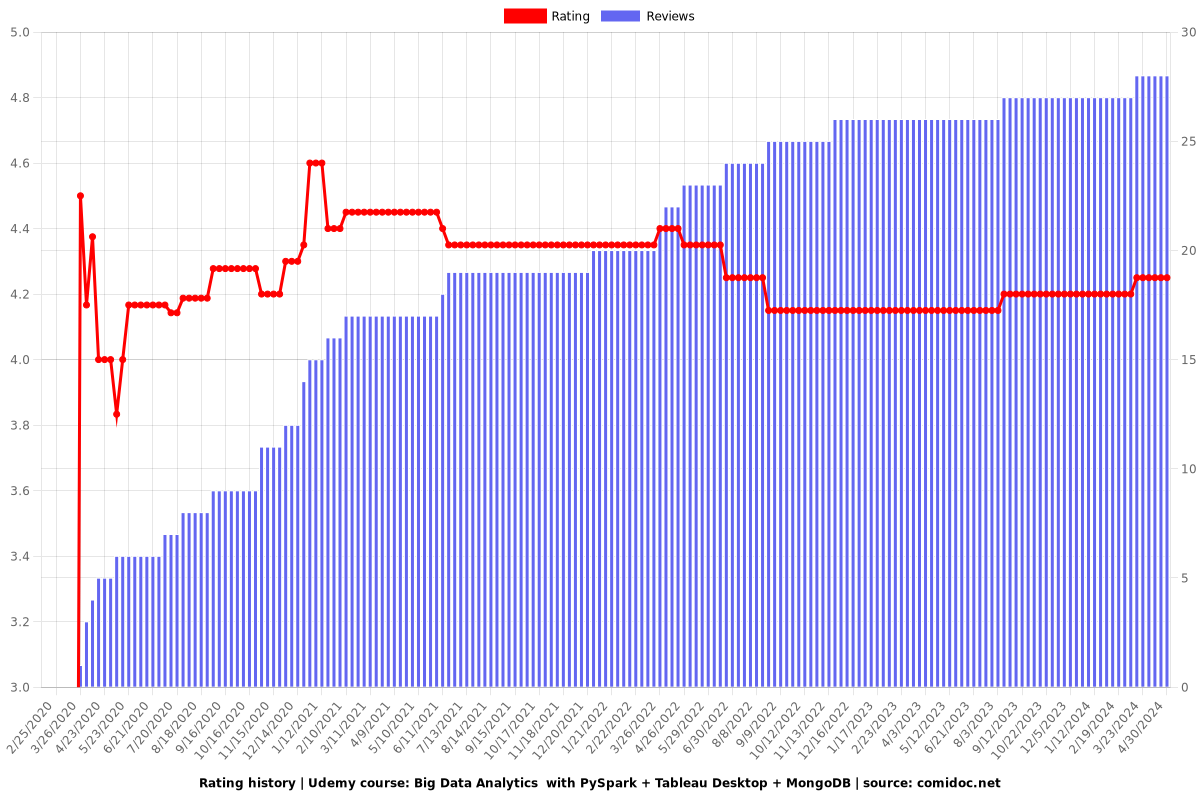
Rating
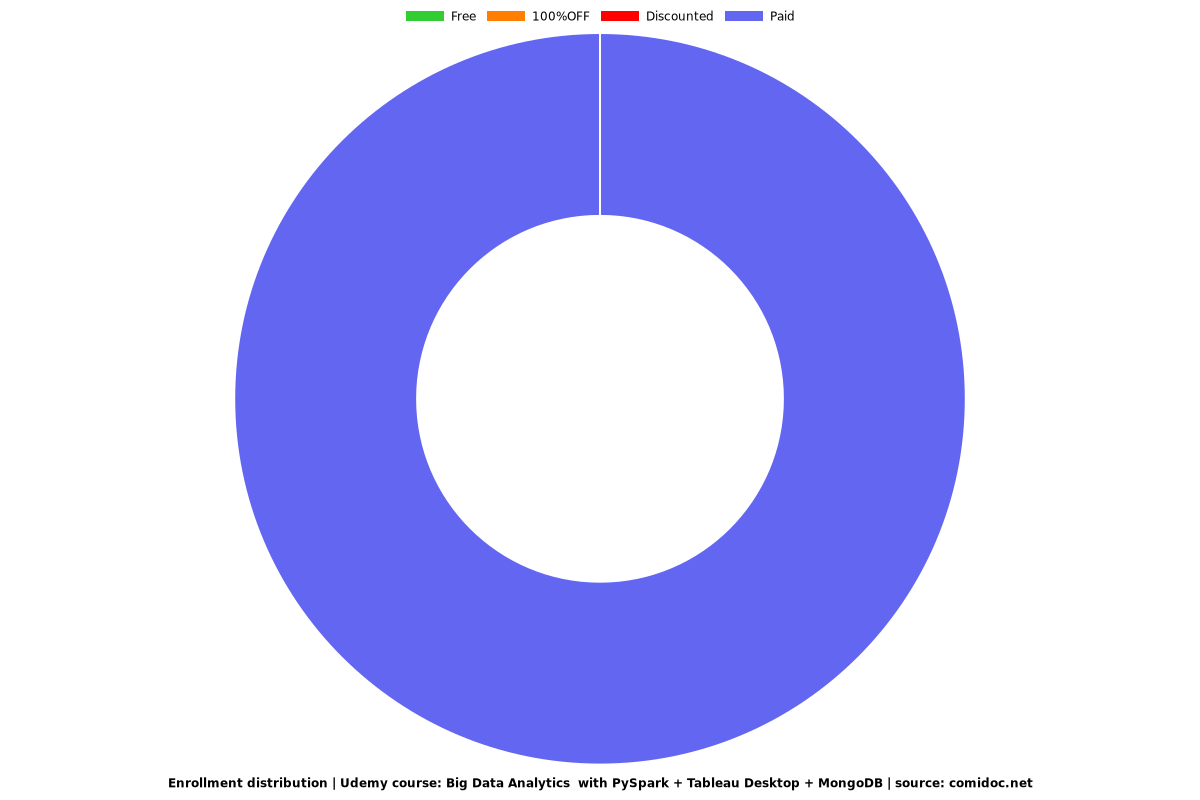
Enrollment distribution