Automate SQL queries for Data Analysis and Visualization
Learn how to automate SQL queries for data analysis and visualization with Python and MySQL Database

What you will learn
Introduction to MySQL and the Sakila sample database.
How to set up Python with MySQL using the pymysql library.
How to create a connection to a MySQL database using SQLAlchemy.
How to execute SQL queries in Python.
How to load SQL query results into pandas DataFrames.
How to filter, sort, and aggregate data using pandas.
Joining tables in SQL and combining data from multiple sources.
Introduction to data visualization using the matplotlib library.
Creating various types of plots with matplotlib (e.g., bar charts, line charts)
Customizing plot appearance, labels, and legends in matplotlib
How to ask meaningful questions and generate insights from the data.
Working with time series data and analyzing trends over time.
How to explore correlations and relationships between variables.
Grouping and aggregating data to explore patterns and trends.
Why take this course?
In today's data-driven world, the ability to analyze and visualize data is an increasingly sought-after skill across various industries. This comprehensive, hands-on course will introduce you to data analysis and visualization techniques using Python and MySQL, leveraging the Sakila sample database. By the end of the course, you will have gained the practical knowledge and skills required to explore, analyze, and present data effectively.
Throughout the course, you will learn how to connect to a MySQL database using Python and the pymysql library, execute SQL queries, and manipulate data using the powerful pandas library. You will dive deep into data exploration, cleaning, and preprocessing techniques to ensure that your data is accurate and reliable for analysis. You will also become proficient in creating a wide range of visualizations using the matplotlib and seaborn libraries to effectively communicate your insights and findings.
The course will guide you through several practical examples and assignments using the Sakila sample database, allowing you to gain hands-on experience in data analysis and visualization. You will work on real-world scenarios, exploring various aspects of the Sakila database, such as customer demographics, film rentals, and revenue trends. Along the way, you will learn how to ask meaningful questions about the data and develop the critical thinking skills necessary to generate valuable insights.
This course is suitable for students, professionals, researchers, data enthusiasts, and anyone looking to expand their skill set in data analysis and visualization using Python and MySQL. The course assumes basic programming knowledge, familiarity with databases and SQL, and a basic understanding of mathematics and statistics. Prior experience with Python, pandas, matplotlib, or seaborn is helpful but not mandatory.
Throughout the course, you will learn:
How to connect to and interact with a MySQL database using Python.
How to create a connection to a MySQL database using SQLAlchemy.
How to load SQL query results into pandas DataFrames.
Creating various types of plots and visualizations using the matplotlib library
How to ask meaningful questions and generate insights from data.
Working with time series data and analyzing trends over time.
Exploring correlations and relationships between variables.
Grouping and aggregating data to explore patterns and trends.
Equip yourself with the skills needed to make data-driven decisions and advance your career with this immersive course on data analysis and visualization .
Charts
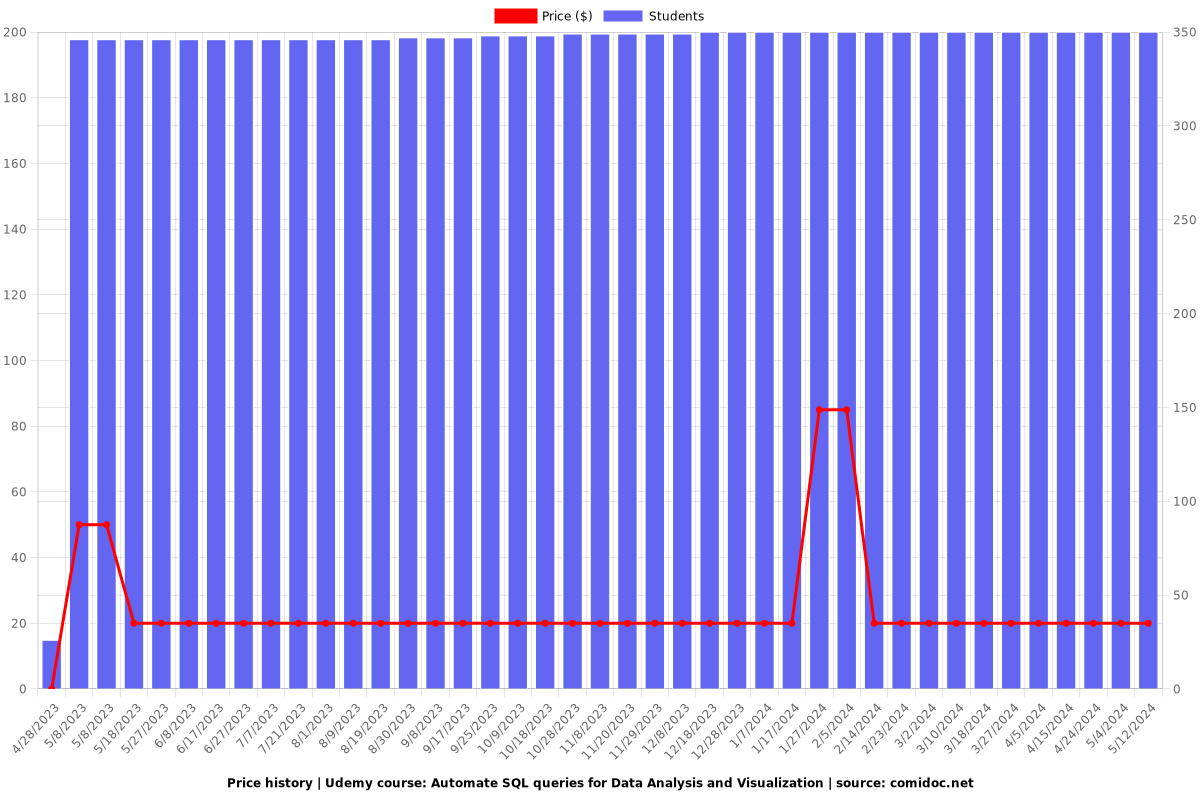
Price
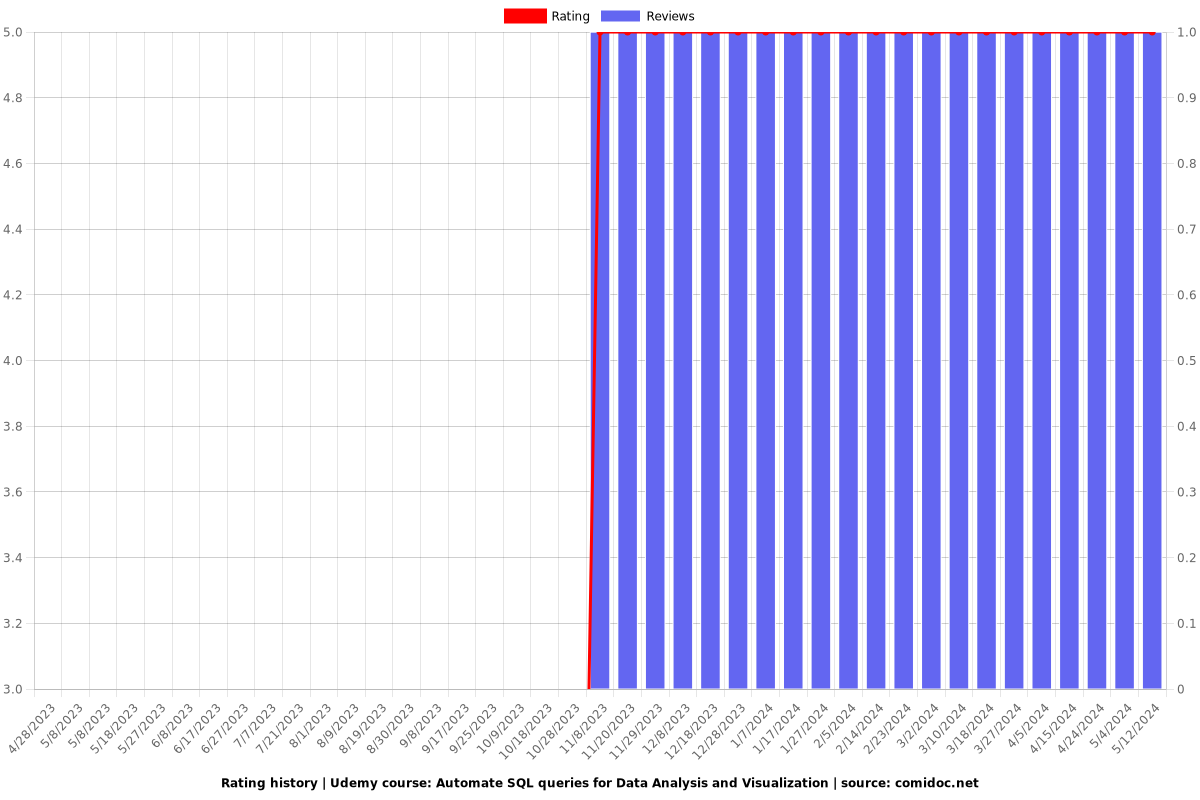
Rating
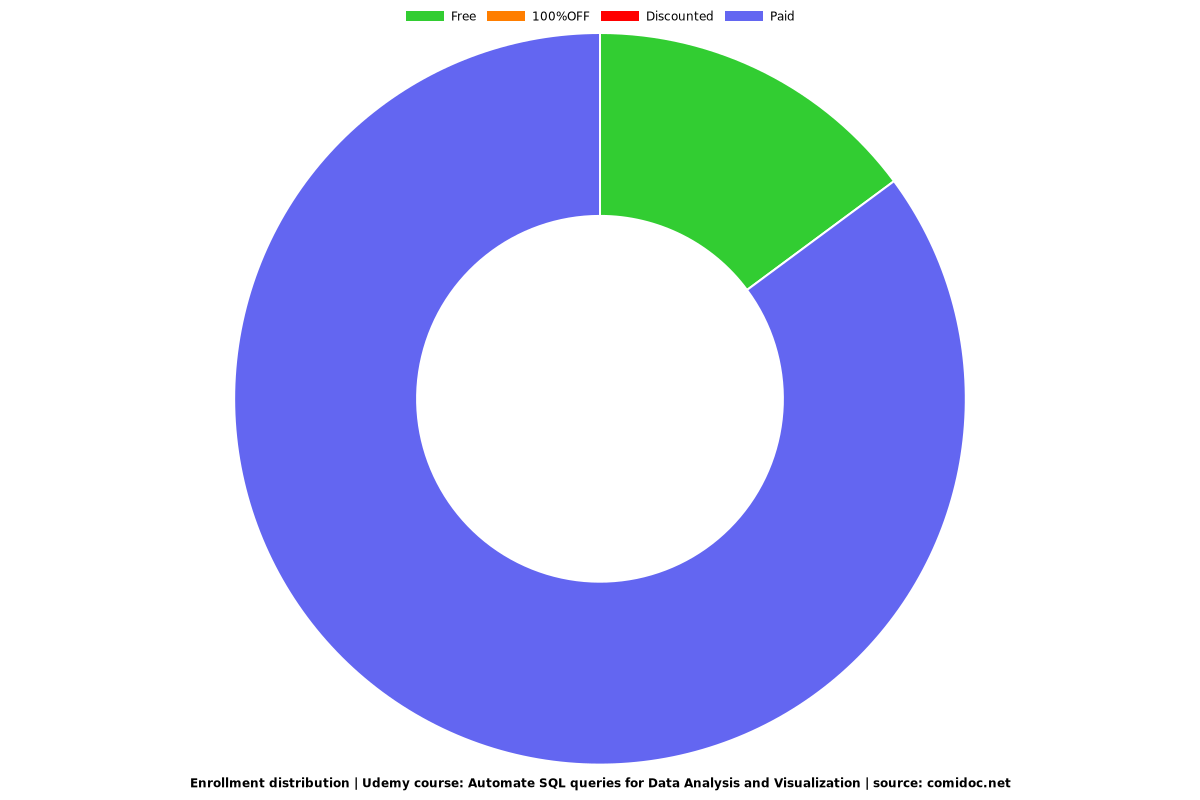
Enrollment distribution