Web and Social Media Analytics with R: 2-in-1
Perform efficient analytics in R to optimize your web apps and enhance your business

What you will learn
Work with Key Performance Indicators (KPIs)
Create an effective measurement model for analytics
Learn with hands-on projects to gain insights into your website's performance
Plot cumulative transaction plots to understand the effectiveness of your marketing campaigns
Harness the power of social media analytics to improve your website or business
Use the R-markdown language to generate easy-to-understand PDF reports and dashboards.
Why take this course?
R is a popular choice of tool for analysts, offering a large variety of libraries pertaining to each and every task in data analysis. With practical projects based on various real-world domains and use-cases where web analytics can be used, this course will be your companion for implementing the various web analytics techniques using the free, open source libraries provided by R.
In this comprehensive 2-in-1 course, you will be introduced to important topics in web analytics with interesting hands-on projects to assess the performance of your website. This action-packed, must-have tutorial covers everything that you'd want to learn in web analytics for your website, and covers key concepts using R, Google Analytics, and the Flex dashboard.
This training program includes 2 complete courses, carefully chosen to give you the most comprehensive training possible.
The first course, Web Analytics with Hands-on Projects in R, starts off with covering the basics of web analytics, and why it is used in businesses worldwide. You will then be introduced to R and its libraries and will understand why R is a great choice for performing real-time analysis of your data, analyzing your websites traffic and customers behavior in real-time and how to use this information to optimize the performance of your website. You will also learn how to use the analytical capabilities of R to fully explore your Google analytics data and generate meaningful visualizations of your data using libraries like ggplot2 and generate reports based on various metrics and combinations. Towards the end of this course, you will have a solid understanding of implementing the various web analytics techniques in R, and maximize your websites performance.
The second course, Visitor Insights and Social Media Analytics in R, starts off with an overview to the key concepts such as segmentation followed by a project in which you’ll learn how to plot past 6 months visitors data on a website. You will then learn to plot revenue over the last 12 months on the same website along with cumulative transactions. Towards the end of this course, you will be able to carry out the segmentation and categorization of your website's traffic and recognize loyal visitors and the impact of social media on your visitors.
By the end of this Learning Path, you'll learn to use R to analyze the performance of your website and increase your website's traffic and revenue.
Meet Your Expert(s):
We have the best work of the following esteemed author(s) to ensure that your learning journey is smooth:
- ●William Shin received his PhD from Columbia University in 2017 in biological sciences with specialization in computational biology. He has been an avid user of R since 2009 and has been using statistics to gain insights into large datasets since 2007. He has been a consistent contributor in digital analytics, a frequent speaker at conferences, and a wide range of regional events around the world.
Content
Web analytics with hands on projects in R
Visitor Insights and Social Media Analytics in R
Screenshots


Reviews
Charts
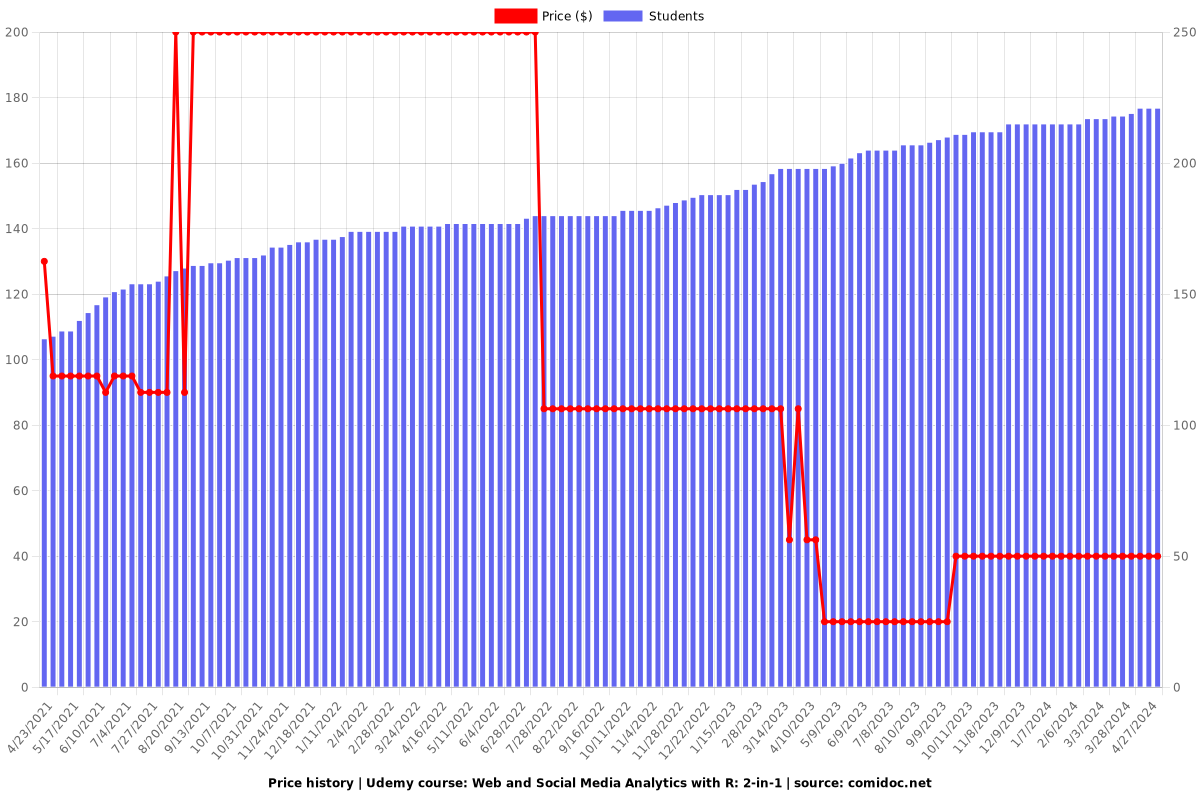
Price
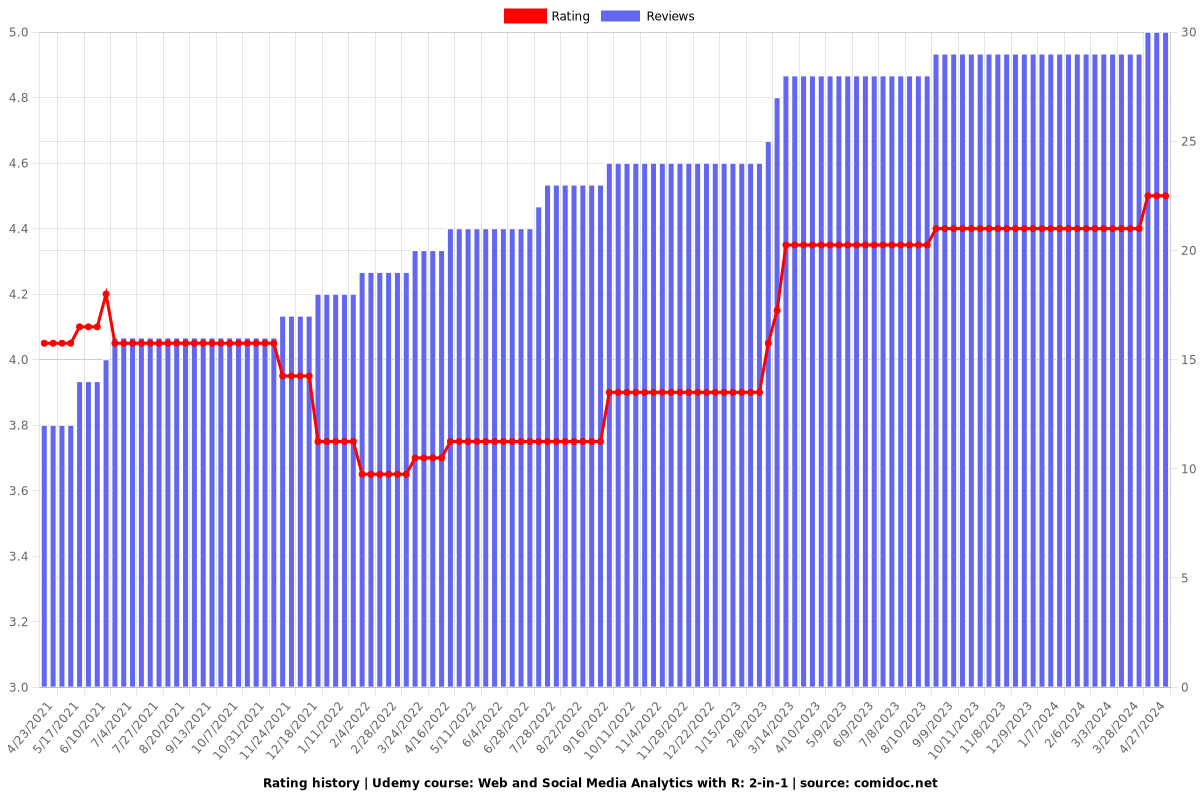
Rating
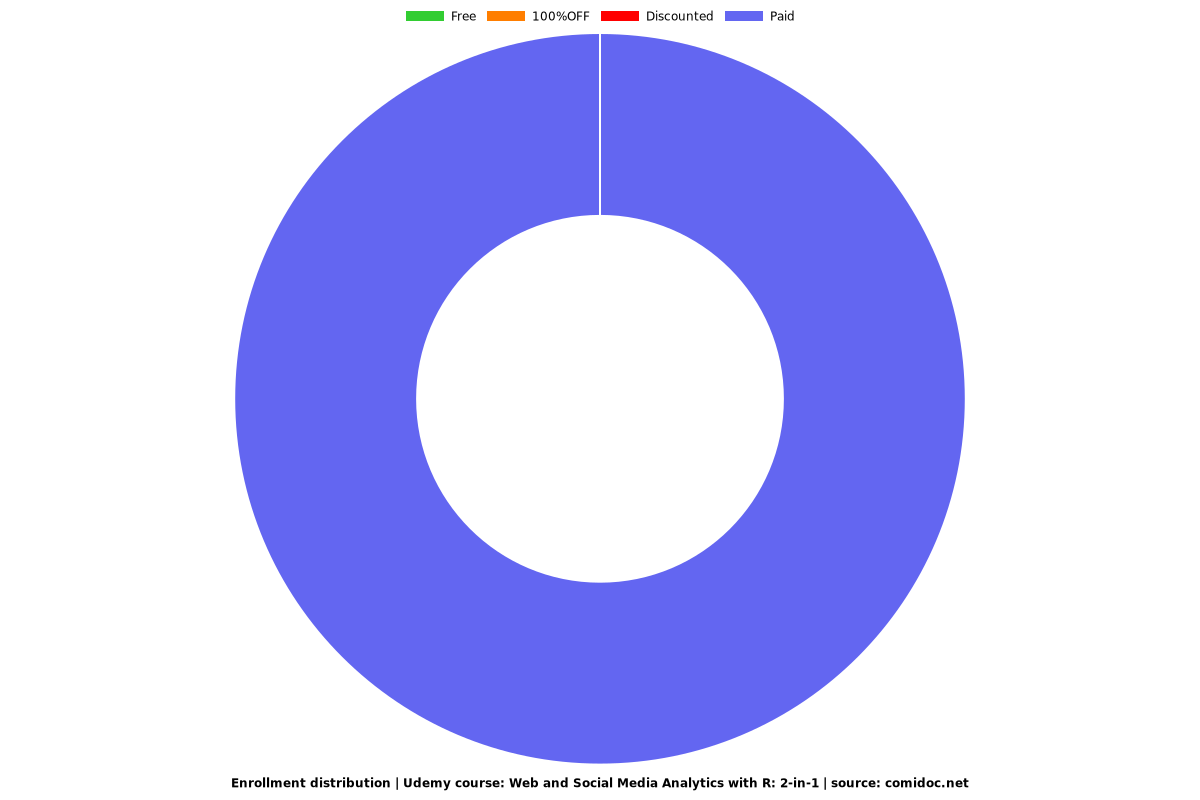
Enrollment distribution