Visualization and Imputation of Missing Data

Learn to create numerous unique visualizations to better understand patterns of missing data in your data sample.

3.15 (37 reviews)
Udemy
platform
English
language
Social Science
category
Visualization and Imputation of Missing Data
1,301
students
5 hours
content
Sep 2020
last update
$29.99
regular price

What you will learn

Use visualizations created by R software to identify patterns of 'missingness' in data sets and to impute reasonable values to replace the missing data.

Recognize and identify the different patterns of missing data and the relative severity of their likely consequences.

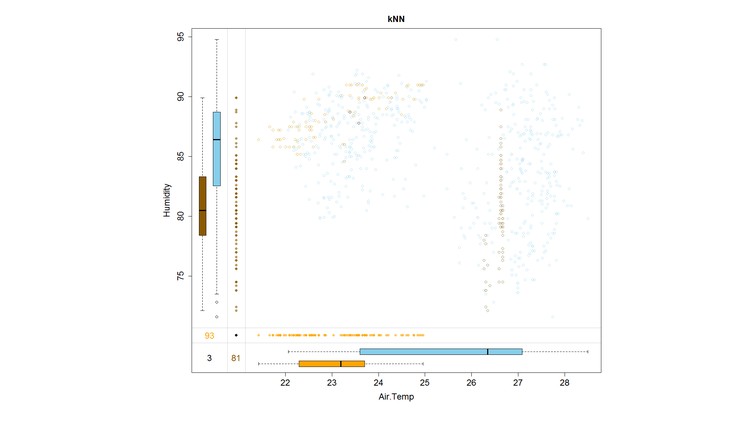
Learn to use the VIM and VIMGUI R packages to create unique, novel and vibrant images which promote the understanding of patterns of both missing and imputed data in a set of data.

Learn the different historical approaches to impute reasonable values for missing data and their relative advantages and disadvantages.

Learn the characteristics of: (1) Hot-Deck; (2) K-Nearest Neighbor; (3) Regression-Based; and (4) Iterative, Model-Based, Stepwise Regression (IRMI) imputation techniques to "fill in" missing data and when and how to implement them with provided software.

Why take this course?

There are many problems associated with analyzing data sets that contain missing data. However, there are various techniques to 'fill in,' or impute, missing data values with reasonable estimates based on the characteristics of the data itself and on the patterns of 'missingness.' Generally, techniques appropriate for imputing missing values in multivariate normal data and not as useful when applied to non-multivariate-normal data. This Visualization and Imputation of Missing Data course focuses on understanding patterns of 'missingness' in a data sample, especially non-multivariate-normal data sets, and teaches one to use various appropriate imputation techniques to "fill in" the missing data. Using the VIM and VIMGUI packages in R, the course also teaches how to create dozens of different and unique visualizations to better understand existing patterns of both the missing and imputed data in your samples.

The course teaches both the concepts and provides software to apply the latest non-multivariate-normal-friendly data imputation techniques, including: (1) Hot-Deck imputation: the sequential and random hot-deck algorithm; (2) the distance-based, k-nearest neighbor imputation approach; (3) individual, regression-based imputation; and (4) the iterative, model-based, stepwise regression imputation technique with both standard and robust methods (the IRMI algorithm). Furthermore, the course trains one to recognize the patterns of missingness using many vibrant and varied visualizations of the missing data patterns created by the professional VIMGUI software included in the course materials and made available to all course participants.

This course is useful to anyone who regularly analyzes large or small data sets that may contain missing data. This includes graduate students and faculty engaged in empirical research and working professionals who are engaged in quantitative research and/or data analysis. The visualizations that are taught are especially useful to understand the types of data missingness that may be present in your data and consequently, how best to deal with this missing data using imputation. The course includes the means to apply the appropriate imputation techniques, especially for non-multivariate-normal sets of data which tend to be most problematic to impute.

The course author provides free-of-charge with the course materials his own unique VIMGUI toolbar developed in the RGtk2 visualization programming language in R. However, please note that both the R-provided VIMGUI package (developed in RGtk2), as well as the course author's provided VIMGUI toolbar application (also developed in RGtk2) may have some problems starting up properly on a Mac computer. So if you only have a Mac available to you, you may have some initial difficulties getting the applications to run properly.

Screenshots

Visualization and Imputation of Missing Data - Screenshot_01Visualization and Imputation of Missing Data - Screenshot_02Visualization and Imputation of Missing Data - Screenshot_03Visualization and Imputation of Missing Data - Screenshot_04

Reviews

Perry
June 25, 2022
Explanation of theory is okay, however the tutorial about the technical stuff like installing VIMGUI etc does not work. Please offer tutorials that work and don't let students figure out how the technical issues should be resolved. Sorry for me it did not help me and I think it was a waste of time and money.
Sasha
April 24, 2022
Having problems with installing packages, support in this area is not very good. If you can't install the packages you can't do the course. The narration during the course is a bit slow.
Todd
December 1, 2019
This course is a comprehensive covering of missing values and how to impute them using an R plug in. The instructor knows the software and uses examples to illustrate techniques discussed in the slides.
Claudiu
April 7, 2018
The course gives a very good overview of VIM package together with practice examples. The course is engaging and provides well commentated code as well as introducing 2 GUIs. On the down side, some of the imputation methods aren't explained, and the real improvement to the course would be to add Hmisc, mice and Amelia packages to the missing values analysis and imputation toolbox.
Kevin
November 19, 2017
This course deals with the important topic of missing data. It mostly based on the VIM package. In my option it is really nice introduction on the topic. I missed the MICE package in the course.
Raviteja
May 12, 2017
Enjoyed the lecture thoroughly. DO you have any update to learn other techniques in detail ? (other than knn)
Patrick
May 25, 2016
Interesting course that covers a lot of complicated techniques, but I am still not sure where I would use these techniques. Seems like a lot of overkill to fix missing values.

Charts

Price

Visualization and Imputation of Missing Data - Price chart

Rating

Visualization and Imputation of Missing Data - Ratings chart

Enrollment distribution

Visualization and Imputation of Missing Data - Distribution chart

Related Topics

631264
udemy ID
10/5/2015
course created date
11/22/2019
course indexed date
Bot
course submited by