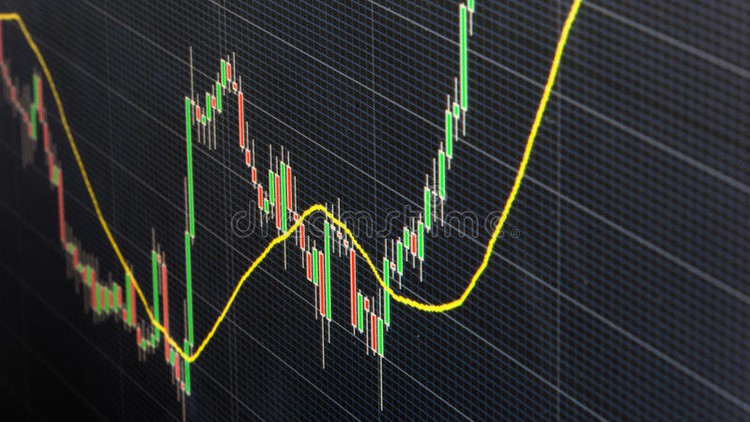
Technical analysis with Indicators & candlestick patterns

trading strategies using RSI, ADX, Bollinger band, Support resistance, MFI , Pivot points etc

4.60 (35 reviews)
Udemy
platform
English
language
Investing & Trading
category
Technical analysis with Indicators &  candlestick patterns
107
students
7 hours
content
Jan 2024
last update
$44.99
regular price

What you will learn

Trader will able to learn different trading strategies using technical indicators

Traders can use these trading strategies to be profitable

Trader will have knowledge pivot points and support resistance

Trades will be covered with examples of technical chart so he will have better knowledge

Why take this course?

This course will cover following strategies with technical indicators and without technical  indicators

1. Trading with candlestick ,  RSI and ADX

2. Trading with support and resistance

3. Trading with candle sticks,  pivot points

4. Trading with candlestick ,  Fibonacci and support resistance

5. Moving average crossover strategy

6. 50 EMA, MACD and MFI Strategy

7. Super trend (7,3), (7,4) , RSI and Parabolic SAR

8. 20 & 40 Simple moving Average and parabolic SAR Strategy

9. Bollinger RSI band trading strategy

10. Winning Trade Technique

11. MACD Trendline Trading strategy

Aside technical analysis basic details will be explained

12. Technical indicators

13. Pivot Points, Fibonacci and Trend lines

14. Candle stick patterns

15. stock selection and entry exit criteria in Intra day trading

16. Trading physiology and Qualities of good trader

17. Live trader for 15 minutes timeframes for all trading strategies captured and shared

Note:

1.  Major technical indicators technical indicators- CCI, ADX, RSI, Moving average, Super trend etc.

2. Aside , Price action Trading without indicators (15 minutes candles breakout , Previous day open low high breakout strategies and more...) for trader who are not willing to use technical indicators.

3. Trader use these trading strategies with paper trade and can use one of best which is most suitable for him.

4. Time frame for trade will be explained which is suitable for him.

5. On line support can be provided on request in special cases for trader in case trader wants support

Screenshots

Technical analysis with Indicators &  candlestick patterns - Screenshot_01Technical analysis with Indicators &  candlestick patterns - Screenshot_02Technical analysis with Indicators &  candlestick patterns - Screenshot_03Technical analysis with Indicators &  candlestick patterns - Screenshot_04

Charts

Price

Technical analysis with Indicators &  candlestick patterns - Price chart

Rating

Technical analysis with Indicators &  candlestick patterns - Ratings chart

Enrollment distribution

Technical analysis with Indicators &  candlestick patterns - Distribution chart

Related Topics

4296846
udemy ID
9/13/2021
course created date
10/1/2021
course indexed date
Bot
course submited by