Learn Infographic Design

Infographic design part 1

4.30 (34 reviews)
Udemy
platform
English
language
Graphic Design
category
instructor
3,633
students
2 hours
content
Sep 2018
last update
$24.99
regular price

What you will learn

Understand the anatomy of an Illustrator graph.

Build stunning and editable graphs to represent data and statistics using Column graphs, pie charts, Donut charts, stacked column graphs, area and line graphs.

Stylize any graph type and create appealing designs to your graphs, define the scale for charts and add numeric values.

Design your own chart from scratch.

Master the most used tools and options in Illustrator that are used in infographic design.

learn some tips to give your map stunning look, learn how to create different types of the location sign and all other elements related to maps and locations.

Create plenty of infographic elements including all the human icons that are used in expressing ratio and percentage, stylish lists, rating stars and ratio bars

Effectively Use patterns and learn the way to edit them and use them in infographic design.

Use different techniques to create hand drawn infographics including hand drawn shapes, column graphs, pie charts, custom objects and even hand drawn texts.

Create different sketch papers that are used in hand drawn infographics.

Description

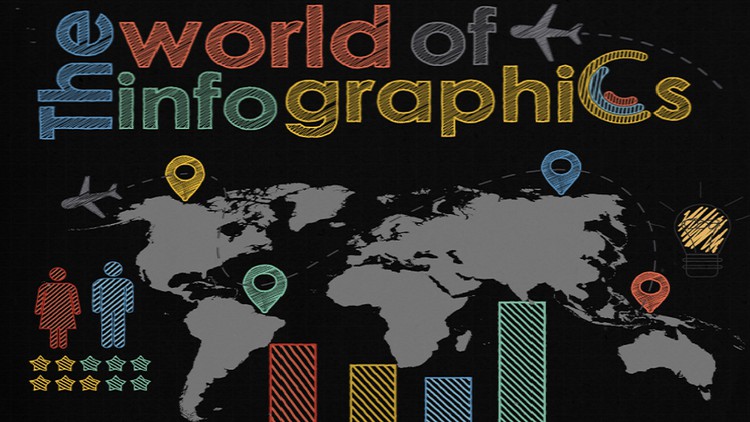
Why “The world of infographics” ?!

As always said “the shortest distance between two people is a story” and I believe that the best way to tell a story is through infographics and the shortest way to learn infographic design is getting through “the world of infographics”. This course is the first part of a series of course on “Infographic design” that would help you design stunning appealing infographics. You don't need any previous experience in design, all that you need is a copy of Adobe Illustrator CC and a little basic knowledge of its most common tools like the type tool, so you don't have to worry as every option or tool that I used would be explained in that course.

By the end of that course students would be able to

  • Understand the anatomy of an Illustrator graph.
  • Build stunning and editable graphs to represent data and statistics including Column graphs, pie charts, Donut charts, stacked column graphs, area and line graphs.
  • Stylize any graph type and create appealing designs to your graphs, define the scale for charts and add numeric values.
  • Design your own chart from scratch
  • Master the most common tools and options in Illustrator that are used in infographic design.
  • Create vector map of the world or any custom place, highlight any part of that map, adjust the border's color and  the background of the map , adjust the perspective of the maps to give it a more realistic look, learn some tips to give your map stunning look, apply pattern fill to any map, learn how to create different types of the location sign and all other elements related to maps and locations...
  • Create a lot of infographic elements including all the human icons that are used in expressing ratios and percentage, stylish lists, rating stars and ratio bars, stylish title bars.
  • Effectively Use patterns and learn how to edit them and use them in infographic design.
  • Use different techniques to create hand drawn infographics including hand drawn shapes, column graphs, pie charts and any custom objects.
  • Apply hand drawn effect to any font.
  • Use a package of free hand drawn fonts.
  • Create different sketch papers that are used as a background in hand drawn infographic projects.

And as I always believe that the best way to learn is through practice, I uploaded almost every single file and image that I used in any video so that you can use it to practice step-by-step with me. So, every video can be considered an application for you. However, at the end of each section you will have a real application as you will be asked to design a project using all the tools, options and techniques that you've learned through each section.

I’m waiting for you in my infographic world

Content

Introduction

Introduction

Graphs

Pie charts
Donut pie charts
Circular charts
Column graph
Editing value & category axes
Column design 1 (Repeating, vertically & uniformly scaled)
Column design 2 (Sliding design)
Column design 3 (Value design)
Line Charts & Marker design
Project (1)

Infographic tools

Image trace option.
Image trace - Infographic applications.
Blend option.
Infographic application: Creating a stylish timeline
Rotate tool
Infographic application(1) - creating gear infographics
Infographic application(2) - Circular infographic
Project (2)

Maps & locations

The world map
Custom map
Location signs
Project (3)

Hand drawn infographics

Hand Drawn effects
Hand drawn shapes
Hand drawn column & bar charts
Hand drawn pie charts
Text
Patterns
2nd Hand drawn effect: Part(1)
2nd Hand drawn effect: Part(2)
Sketch paper
Project (4)

Infographic elements

Male icon
Female icon
Human icon
Title bars
Rating stars & Ratio bars
Infographic list
The start ...

Screenshots

Learn Infographic Design - Screenshot_01Learn Infographic Design - Screenshot_02Learn Infographic Design - Screenshot_03Learn Infographic Design - Screenshot_04

Reviews

Arvilla
August 21, 2022
The examples are really great! maybe the voice quality should have been better but overall it's amazing
Selena
August 21, 2022
I wasn't sure that I would be able to start my own infographic project after the course but that was really helpful! thank you
Janet
January 29, 2019
It is a little difficult understanding the lecturer at times, however he explains things well enough that you do understand in the end.
Carly
October 12, 2018
Learnt so much in just these 2 hours! Never realised how useful Illustrator could be. Makes it look easy to produce the infographics we need.
Rheariel
August 14, 2018
Angielski trudny do zrozumienia co sprawia, że kurs jest zbyt męczący żeby go kontynuować. Nie polecam.
Rubina
January 25, 2018
A very good and compact curriculum for beginners. Easy to understand, and covers more or less all aspects of how to get started and create an infographic. The pace is good, and the has been broken down into bite-sized chunks which are easy to grasp and understand. The only suggestion I have is this was purely on Adobe Illustrator. Please also include courses where other software can be used.

Charts

Price

Learn Infographic Design - Price chart

Rating

Learn Infographic Design - Ratings chart

Enrollment distribution

Learn Infographic Design - Distribution chart
1343654
udemy ID
9/6/2017
course created date
10/16/2020
course indexed date
Bot
course submited by