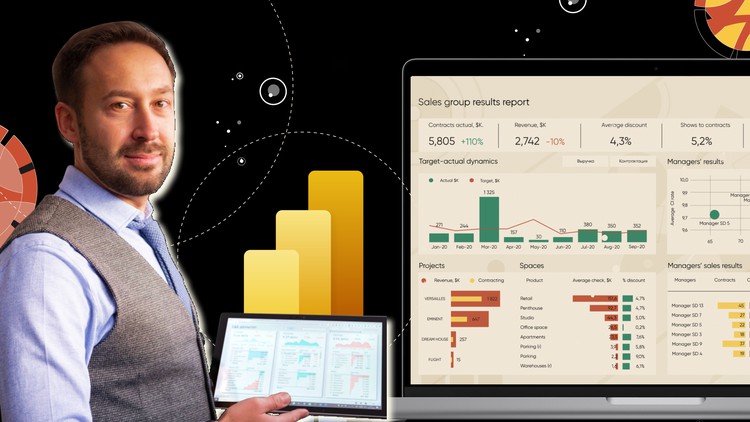
Power BI for Business Users

Make your data speak!

4.31 (1075 reviews)
Udemy
platform
English
language
Data & Analytics
category
instructor
Power BI for Business Users
18,827
students
1 hour
content
Mar 2024
last update
FREE
regular price

What you will learn

Create beautiful dashboards instead of boring spreadsheets and slides

Make involving presentation based on interactive visual story

Create visualizations without programming skills

Learn some interesting tips to simply working with Power BI

Why take this course?

The more data you have, the harder it is to highlight key metrics. Can data analysis in Excel and preparing presentations in PowerPoint clarify the main tendencies in your datastore? Or do you drown into unrelated reports and typical slides? Dashboard created in Power BI is the best way to combine data analysis and storytelling. Plenty of charts, cards, and Key Performance Indicators are matched on one dashboard. This tool is useful for CEO and non - management employees as well. Managers are able to control the progress of different departments, product sales, or finishing working processes. As for employees, some dashboards are good motivators to estimate everyone’s progress in comparison with others and push harder.

This short course will help you to get acquainted with presenting data in Power BI. Also, you will learn how to tell a story based on your data. You can take this course lacking a having any experience in working with Power BI and Excel. However, you should install Microsoft Power BI on your PC. I hope, this quick introduction will convince you to add using Power BI into your everyday working routine. This in turn help to improve business processes in your company or department.

Screenshots

Power BI for Business Users - Screenshot_01Power BI for Business Users - Screenshot_02Power BI for Business Users - Screenshot_03Power BI for Business Users - Screenshot_04

Reviews

Gabriel
September 26, 2023
The course is presenting a lot of useful information and has very good resources which aid in the learning process. Would have been a five star course if the presenter will show the steps of using Power Bi slower so the students could follow the steps more easy.
Eugene
May 14, 2023
Started off skeptical, my version of Power BI was different and found it difficult to follow at first. By the end was quite comfortable with the problems / assignments, enjoyed the course and learnt a lot
Maria
April 6, 2023
the voice goes on and off and is not synchronized with what you show in the formatting part, it makes it difficult to follow what you do. First you say what you will do and then you do it clicking very quickly, you should speak and click at the same time slowly so that viewer can follow with the instructions.
Vishakha
February 7, 2023
THE BEST THING ABOUT THE COURSE IS YOU GET THE DATA SO THAT YOU CAN PRACTICE AS WELL ON THE DATA SET.. GOOD COURSE TO START WITH POWER BI.. THANKYOU..
Shannon
January 18, 2023
The Sales Dynamics resource is missing from the course material. This has been mentioned in reviews as far back as 9 months ago so should have been resolved by now. It prevents you from following along for those sections which are core to the course. The material up till now has been good but at times difficult to follow due to speed of movement in the recordings.
Sherisse
December 3, 2022
Little explanation as to why we are creating presentations in the specific manner in the exercise. Hard to follow along as the instructor is moving too fast. I often had to pause and/or rewind.
Saju
October 31, 2022
Loved the pace and presentation!! Also, thankful for the resources provided which really helps in practicing during my spare time.
Ben
October 27, 2022
There are times where the auto in the video cuts out while it is speed through the lessons that is being talked about. But outside of the audio cut outs and the speed ups in the video itself, it was ok and could use more improvements.
Lashmi
September 9, 2022
Very clear & interesting. Section 02: Basic visualization - 10. case study dataset is not available for practice. Its better we can practice it as well.
Ruth
September 5, 2022
great content, even though I've never seen BI before, I feel like my knowledge of Excel charts helps me understand this course
Vadim
July 1, 2022
It was very good, undestandable and usefull. Thank you for great explanation of all these things. Good job!
Валентина
June 29, 2022
I really liked this course. The material is very clearly stated. The course gives you explanation of basic types of visualization’s, it teaches you how to make them more clear and understandable
Tatiana
June 28, 2022
Great course for beginners. I've never used Power BI before, but after finishing this course, I was able to create my first basic dashboard. I really like that the course is short because I didn't have time for full education and I needed a dashboard urgently. Thanks a lot for the author. Really recommend!!!
Николаева
June 27, 2022
Very informative course and the speed of presentation is comfortable enouph. As to me, it's important. I'm sure this course will be usefull for my job.
Tatiana
June 27, 2022
A good course, that gives an overview of the most important components of Power BI. Theory and praxis is the best combination.

Charts

Price

Power BI for Business Users - Price chart

Rating

Power BI for Business Users - Ratings chart

Enrollment distribution

Power BI for Business Users - Distribution chart

Related Topics

4209364
udemy ID
7/28/2021
course created date
8/29/2021
course indexed date
Bot
course submited by