Certification in Point & Figure Chart & P&F Chart Patterns
P&F Chart Pattern Trading System - Learn to Use Technical Analysis & Chart Patterns For Stock Trading & Value Investing

What you will learn
Learn Advantages of Point & Figure Chart in Stock Trading
Learn Point & Figure Chart Patterns like Breakout of Symmetrical triangle Chart Pattern & Others for trading stocks (Based on P&F)
Learn Point & Figure Charts through Stock Trading Case studies like Coca Cola, Bank of America, Pepsi Co. Charts
Learn Breakout of Descending Triangle Chart Patterns based on Stock Trading & P&F Charts
A simple trick to know your odds of success in Stock Trading
Use little-known techniques to greatly reduce Stock Trading risk and maximize profits
Point & Figure Chart is a Top Chart in Technical Analysis
Point & Figure Chart is an import part in getting Technical Analysis Certification
Master Technical Analysis most lethal chart
Why take this course?
*** Course access includes quizzes & homework exercises, 1-on-1 instructor support with LIFETIME access! ***
Hear why this is one of the TOP-NOTCH Stock Trading & Chart Pattern Course on Udemy:
Yes this is a good match, because I want to understand Point and Figure Charts better.
-Reginald Clinton
Saad is excellent at keeping things simple while exploring a complex topic.
-Deran Silva
Hello Sir, Very nicely explained, step by step to help everyone for the future stock planning. good day.. ok..
-Suhas Pathak
TOP-NOTCH Stock Trading & Chart Pattern Instructor
I currently have 71 Knowledge programs with 20,520+ Minutes of Content (342 hours in total) with 112,000+ Satisfied Students enrolled. That’s 14+ days of learning material!
I am currently mentioned in "Most Popular Instructors" tab on Udemy Business/Finance Section.
Stock Trading & Chart Pattern Course Details:
Point & Figure Chart is a chart used for Following Price Trends and to make decisions According to long term trends. Point & Figure Charts differs from traditional Stock Trading charts Example Candlestick chart as Point & Figure Chart doesn't consider time in Analyzing Trends.
Point & Figure Chart Patterns were invented in the late 19th century & have worked since then. Point & Figure Chart Patterns trading is time tested and have always worked in Stock Trading.
Point & Figure Chart never misses a Change in Trend & Therefore it is one of the best kept Stock Trading secret.
Therefore this is your chance to learn a new Skill in Stock Trading. As Point & Figure Chart Pattern is a skill not to be missed.
Point and figure (P&F) is a charting technique used by experienced Stock Investors. Point and figure charting does not plot price against time, Instead it plots price against changes in Trend.
Make Stock Market your darling and you will never see losses.
This course will teach you How Stock Trading Works & How to become a stock trading expert.
Disclaimer Note: This Stock Trading & Chart Pattern course is for educational and informational purposes only. Not recommending of any particular investments such as a particular stock or mutual fund.
Learn Advance Point & Figure Charts for Stock Trading. Advance P&F Chart Pattern are also included (Technical Analysis).
Content
Introduction to Point and Figure Chart
Point & Figure Chart Details
Understanding Point & Figure Chart
Point & Figure Chart Patterns
Point & Figure Chart Trading
Bonus Lecture
Screenshots


Our review
Coupons
| Submit by | Date | Coupon Code | Discount | Emitted/Used | Status |
|---|---|---|---|---|---|
| - | 6/6/2019 | STHFREE | 100% OFF | expired | |
| - | 6/15/2019 | STH15JUN19 | 100% OFF | expired | |
| - | 8/1/2019 | STH1JUL19 | 100% OFF | expired | |
| - | 5/1/2021 | 1APR21 | 100% OFF | 40000/2702 | expired |
| - | 11/24/2021 | 1NOV21 | 100% OFF | 1000/677 | expired |
| - | 11/28/2021 | 2NOV21 | 100% OFF | 1000/950 | expired |
| - | 10/25/2023 | 1OCT23 | 100% OFF | 1000/681 | expired |
Charts
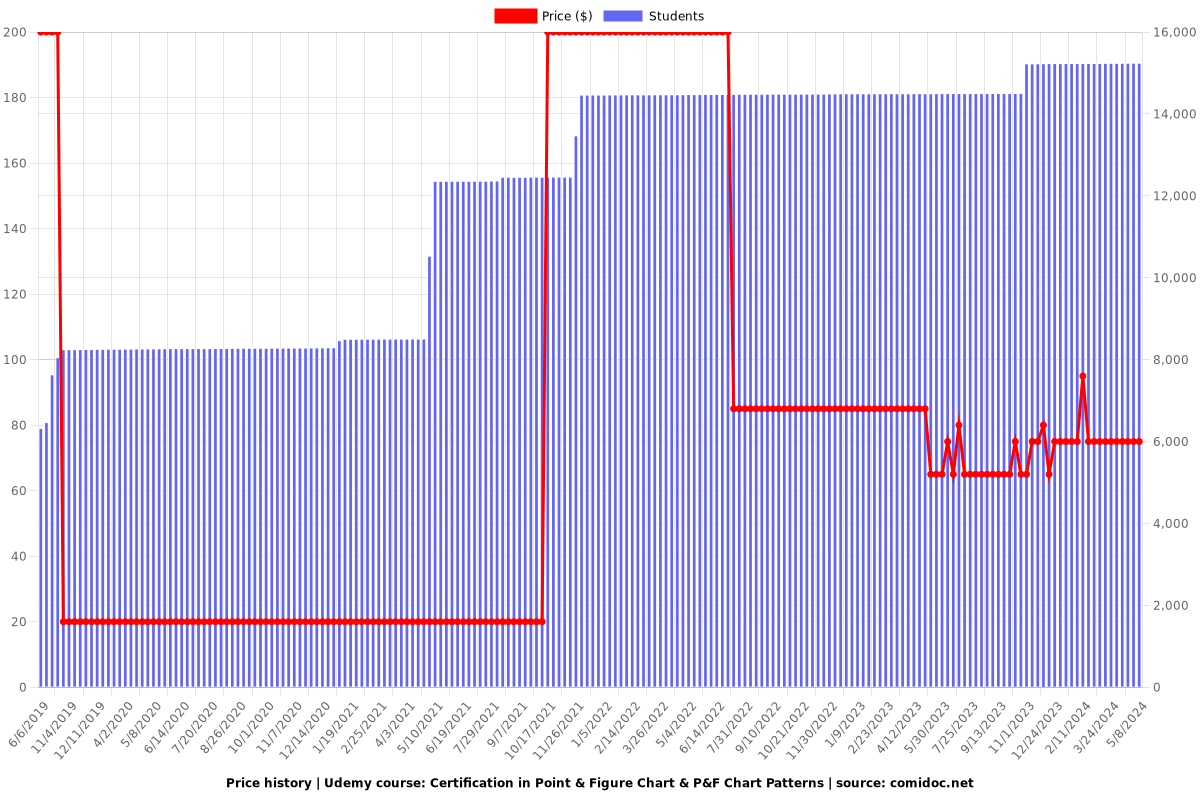
Price
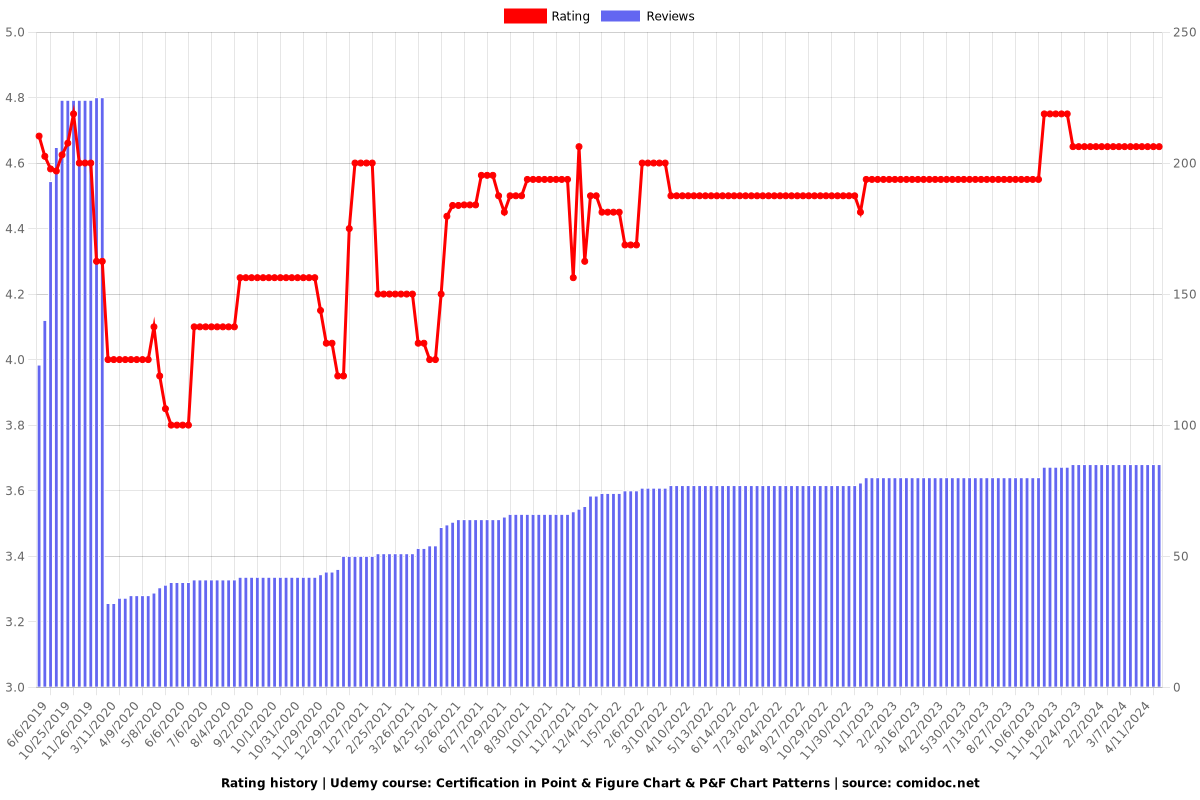
Rating
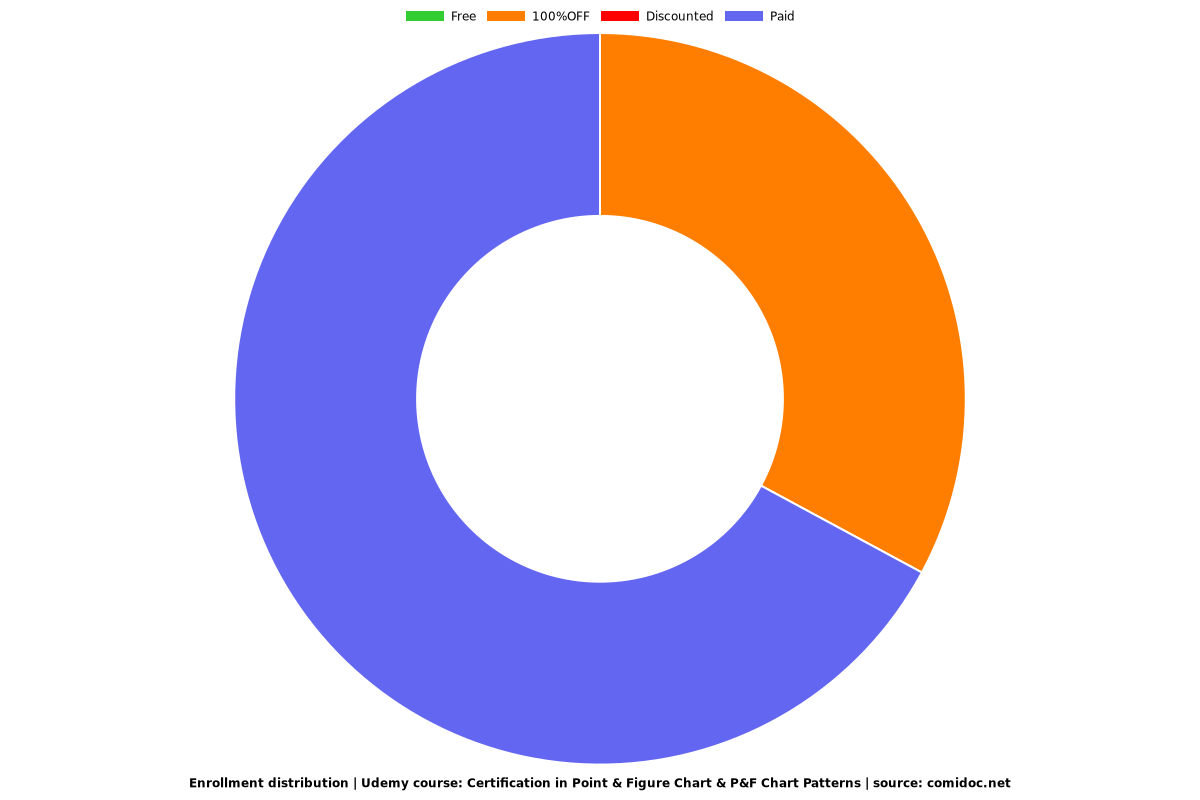
Enrollment distribution