Microsoft Excel Data Analysis - Create Excel Dashboards
Master Excel Data Analysis - Create 6 Dashboards. Microsoft Excel 2013, Excel 2016, Excel 2019 and Microsoft/Office 365
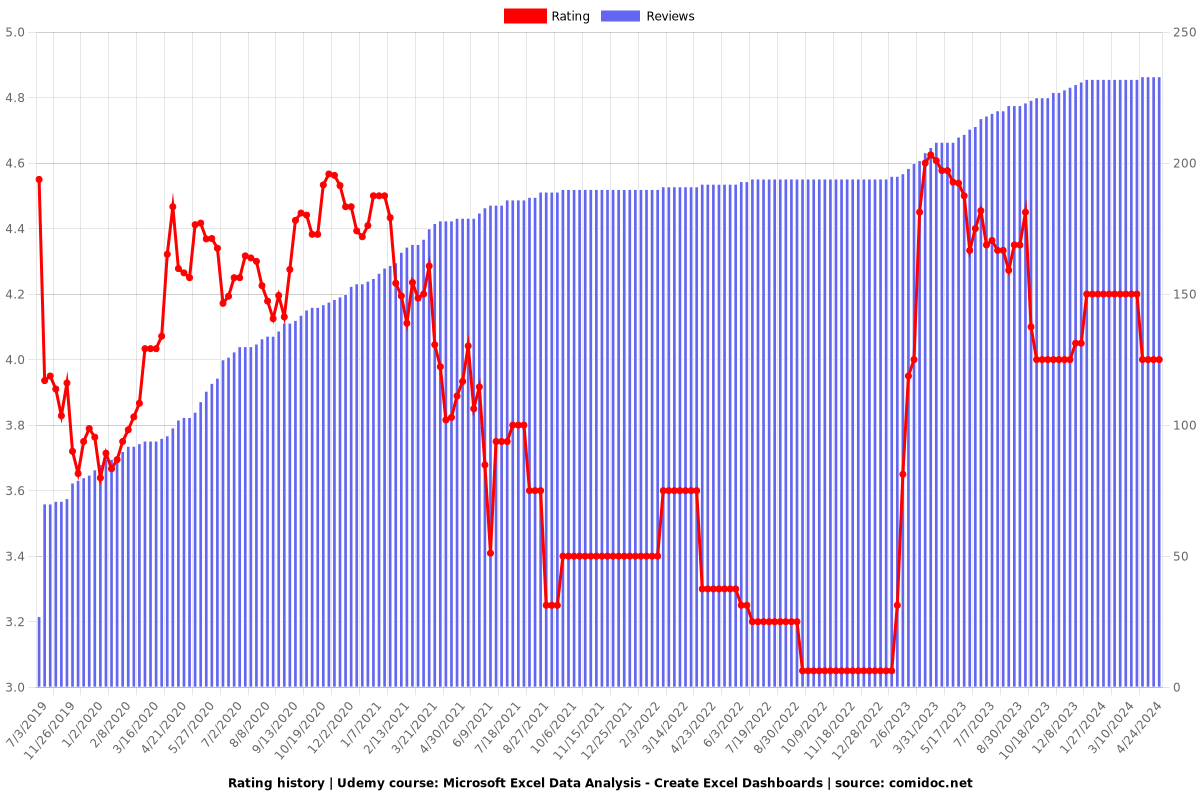
4.00 (233 reviews)

2,359
students
5.5 hours
content
Apr 2022
last update
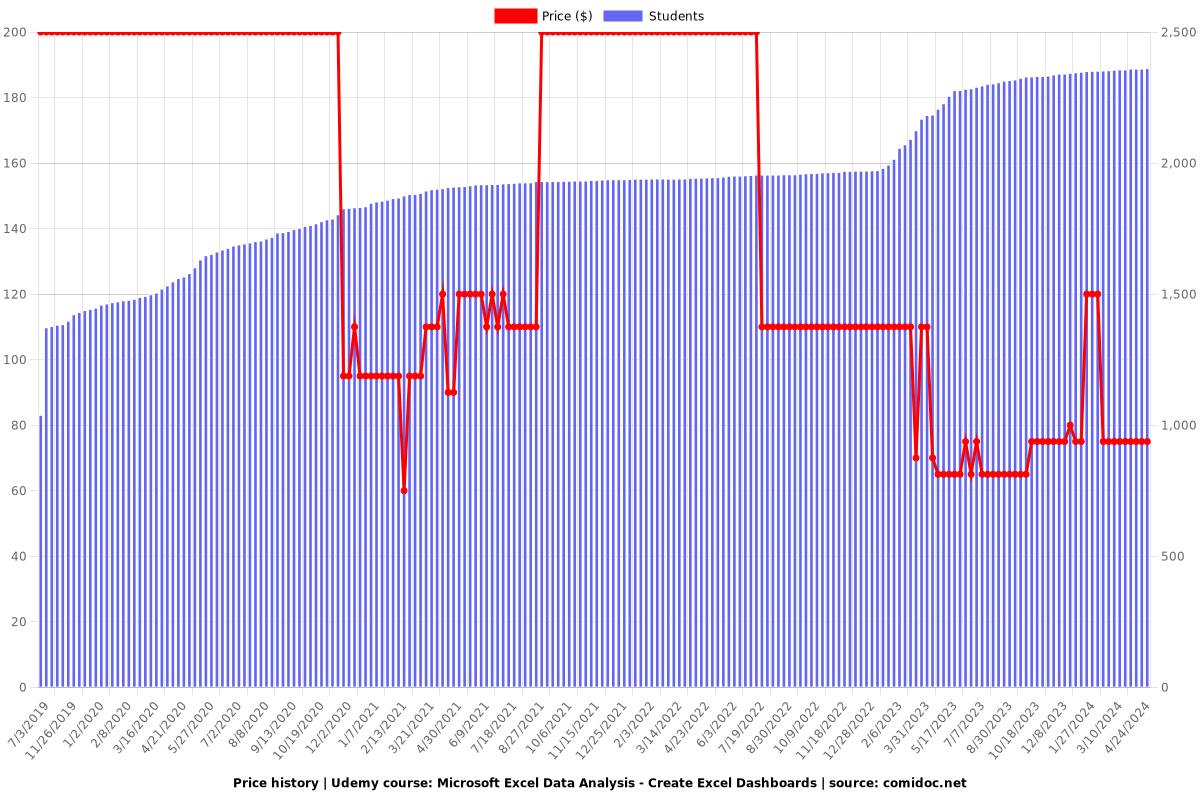
$74.99
regular price
What you will learn
You will learn to create 6 Dynamic Excel Dashboard
You will learn about Pivot Tables and Pivot Chart
You will learn how to Design, Format and Style Data Elements
Learn the Concepts of How to Create and Design an Interactive Excel Dashboard for your department.
Learn Data Analysis using Excel Advanced Formulas
Microsoft Excel Data Analysis with Excel Pivot Tables
Microsoft Excel Data Visualization, Excel Charts & Graphs
Microsoft Excel Data Analysis and Dashboard Reporting
Why take this course?
🎉 **Master Excel Data Analysis - Create 6 Dashboards** 📊
Welcome to the **"Excel Data Analysis Masterclass with Excel Dashboards"** – your ultimate guide to turning complex data into meaningful insights with Microsoft Excel! 🖥️✨
**Course Overview:**
In this comprehensive course, you'll delve deep into the world of **Excel Data Analysis** and **Data Visualization**. With a focus on creating interactive and dynamic dashboards, you'll learn to harness the power of **Excel Pivot Tables**, **Pivot Charts**, and much more. Whether you're using Excel 2013, 2016, 2019, or Office 365, this course is designed to elevate your data handling skills to the next level.
**Key Learning Points:**
- **Excel Pivot Table and Pivot Chart Function**: Master the intricacies of these powerful tools that allow you to analyze large datasets with ease.
- **Dynamic Excel Charts and Graphs**: Learn to create engaging and informative visual representations of your data, enhancing its interpretation and impact.
**What You'll Achieve:**
- 📈 **6 Dynamic Sales Dashboards**: Learn to build a suite of dashboards tailored for sales analytics.
- 🎨 **Design, Style & Format**: Discover how to design, style, and format Excel charts to make them not just informative but also visually appealing.
- 🤖 **Impress with Reports**: Use your new skills to create impressive reports that can speed up the decision-making process for management.
- 🛠️ **Actionable Excel Tips**: Apply practical, actionable tips immediately to start creating eye-catching Microsoft Excel dashboards right away.
- 💪 **Responsive Spreadsheets**: Utilize the core functionality of Excel to ensure your spreadsheets are responsive and adaptable to various data scenarios.
- 🎨 **Smart Techniques for Charts**: Learn to create impressive, non-standard Excel charts using smart techniques that set your visuals apart.
- 📊 **Interactive Dashboards**: Build interactive dashboards based on Pivot Table data for dynamic and responsive data analysis.
**Course Structure:**
This course is structured into **30 Plus chapters**, each meticulously crafted to guide you through the process of creating 6 dynamic Excel dashboards from scratch. You'll learn in depth about dashboards, charts, design elements, and how to make your data analysis both insightful and presentable.
**Step-by-Step Learning:**
We will take you through each **step in detail** to create 6 Dynamic Excel Dashboards using Charts, Design, and Style Elements. This hands-on approach ensures you understand not just the 'how', but also the 'why' behind every technique.
**Who is this course for?**
This course is designed for everyone from beginner to advanced users who wish to enhance their data analysis capabilities with Excel. Whether you're a finance professional, a marketing analyst, a business student, or simply someone interested in leveraging data for better decision-making, this course will provide you with the skills and confidence needed to impress with your reports and dashboards.
🎓 **Invest In Your Future** 🚀
Take the first step towards becoming an Excel Data Analysis expert today. Enroll in this course and unlock the full potential of your data! Let's embark on this journey of learning together – because when it comes to mastering Excel, there's no better time than now! 💻🎉
Let the Masterclass begin! 🚀📈🎓
Screenshots


Our review
---
**Overview of the Course "Creating Interactive Dashboards in Excel":**
The course has garnered an overall rating of 4.00 from recent reviews, indicating a positive reception among learners. The majority of reviews highlight the course's value for inspiration and practical application in dashboard design, with some caveats regarding the pace and presentation style.
**Pros:**
- **Inspirational Content:** Many users found the examples provided for dashboard outputs to be excellent and inspiring.
- **Practical Skills:** The course is beneficial for learning how to create interactive dashboards in Excel, with several reviews mentioning that it delivers actionable and relevant insights.
- **Ease of Learning:** The swift pace allows learners to pause and rewind at their own speed, making the content more accessible.
- **Customer Service:** Exceptional customer service was noted, with one user praising the company for going beyond in assisting with a question and providing valuable tips.
- **Structured Content:** The course is well-structured and provides numerous examples, which are repetitive in a positive way, ensuring that concepts are reinforced.
- **Actionable Insights:** The content is described as good, detailed, and perfect for learning how to create interactive dashboards with detailed explanations.
- **Versatility:** Suitable for various skill levels, from beginners looking to learn new skills to intermediates looking to enhance their capabilities.
**Cons:**
- **Overlap in Content:** Some sections of the course contain repetitive information, which serves as reinforcement but may feel redundant for more advanced users.
- **Pacing Issues:** The fast pace might be challenging for some learners, especially those new to Excel or dashboard creation.
- **Audio and Music:** The constant background music is a point of contention, with several users finding it insufferable and distracting. Some also reported audio issues that made it hard to hear the instructor over the music.
- **Technical Difficulties:** A few reviews mentioned network errors when trying to download files, suggesting potential technical glitches.
- **Prerequisite Knowledge:** The course assumes prior knowledge of Excel formulas and basic features, making it not suitable for complete beginners.
- **Presentation Style:** Some users felt the music and presentation style were strange and detrimental to the learning experience.
**Additional Notes:**
- **Recommendation:** It is recommended that learners have a grasp of Excel formulas and features before taking this course to fully benefit from its content.
- **Alternative Options:** For those who encountered issues with the music and pace, it is suggested to explore free resources or other courses that may offer a more personalized learning experience.
- **Technical Support:** It is crucial for learners to contact customer support in case of technical difficulties like network errors when downloading files.
**Final Verdict:**
"Creating Interactive Dashboards in Excel" is a solid course for individuals aiming to enhance their dashboard creation skills, especially for those who already have a basic understanding of Excel. The course's strengths lie in its well-structured content, detailed explanations, and actionable insights. However, potential learners should be aware of the course's fast pace and repetitive nature, as well as the background music that some may find distracting. With a little adjustment to these aspects, this course could be an outstanding resource for anyone interested in data visualization and dashboard design.
Charts
Price
Rating
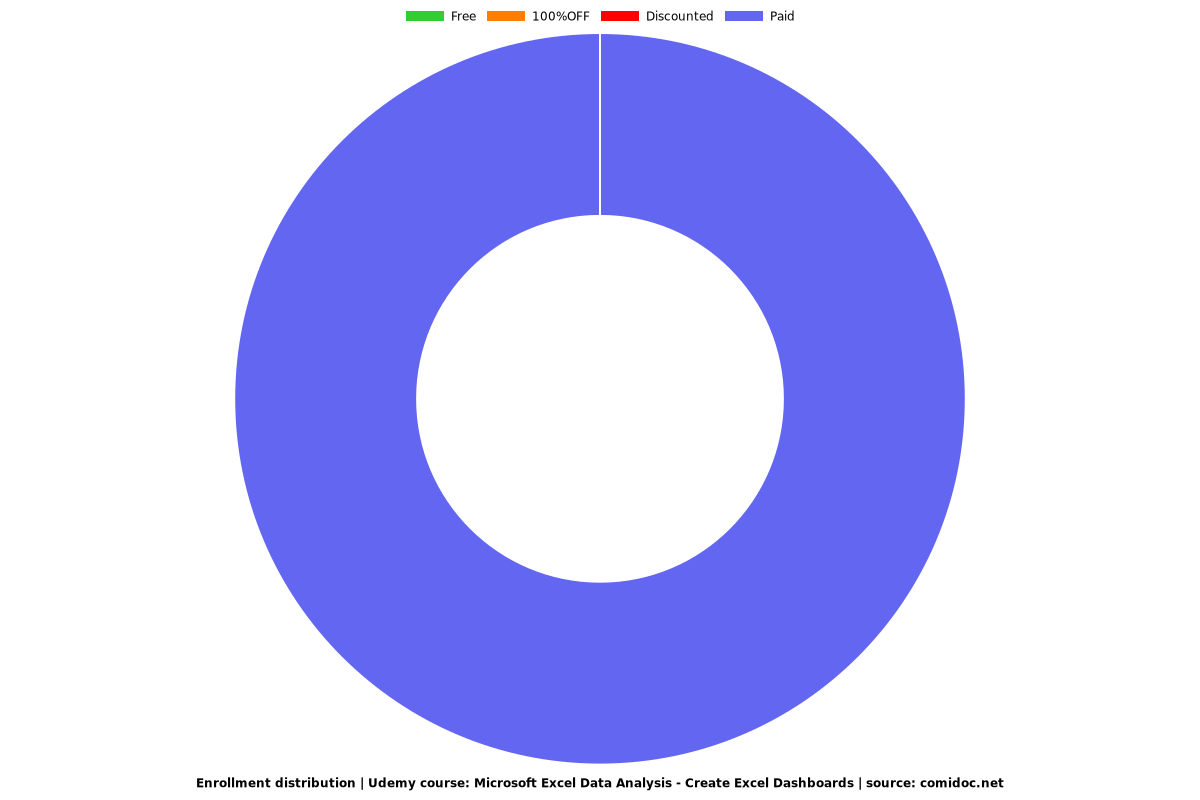
Enrollment distribution
Related Topics
1685608
udemy ID
5/10/2018
course created date
7/3/2019
course indexed date
Bot
course submited by