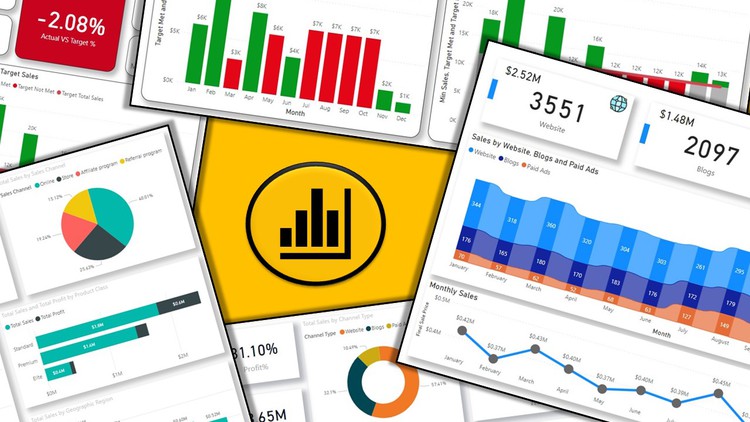
Power Bi - Master Power Bi with 40+ hours of Premium Content

Power Bi master class - Build data models & interactive dashboards using DAX formulas, charts & power query in Power Bi

3.86 (236 reviews)
Udemy
platform
English
language
Data & Analytics
category
1,613
students
41.5 hours
content
Oct 2022
last update
$69.99
regular price

What you will learn

We have covered real life 151 data modelling scenarios using Power Query, DAX and Data Visualization

You will learn to create 5 interactive multipage dashboards. Create and transform raw data into beautiful interactive dashboards using Power Query, DAX.

Master Data Analysis Expressions (DAX) and Power Query (M Language) for Power BI Desktop

Learn how to analyze data from multiple sources, create your individual datasets based on these sources and transform your results into interactive reports

Understand Power BI Desktop and its components. Understand the end to end business intelligence workflow

How to Create, Transform and build Relationships between different tables

How to Build and Refine Data Models using Custom Formulas and How to work in the different views of the Data Model

How to create a report with different interactive visualization types

Showcase your skills with two full scale course projects

At the end of this course students will be able to analyze data from different data sources and create their own datasets

Learn the required knowledge to dive deeper into Power BI applications

How to access your results from multiple devices using Power BI Mobile

Hands On Experience using a Business Intelligence tool like Power BI

Content gets updated each time a new versions of Power BI is released

Description

Master Power BI Desktop & learn advanced Power BI analysis & data visualization

This course will provide you the skillset you need to create Dynamic Reports and Interactive Dashboards to analyze and interpret meaningful insights from your any data using a Business Intelligence tool like Microsoft Power BI. We have created content with relevance to real world scenarios

From this course, you will learn how to analyze data based on relevance using Power BI.

Power BI is a business analytics and business intelligence service by Microsoft. It aims to provide interactive visualizations and business intelligence capabilities with an interface simple enough for end users to create their own reports and dashboards. Power BI is part of the Microsoft Power Platform.

Power BI is a collection of software services, apps, and connectors that work together to turn your data from different sources into visually immersive and insightful reports.

Using Power BI Desktop, you can create rich, interactive reports with visual analytics at your fingertips for free. It can connect to more than 65 on-premises and cloud data sources to turn information into interactive visuals. Data scientists and developers work with Power BI Desktop to produce reports and make them available to the Power BI service.

In Power BI Desktop, users can:

  • Connect to raw data from different sources

  • Extract, Profile, Clean, Transform and model the data. Build a Relational Data Model using Power Query and DAX

  • Build and optimize data models and DAX measures

  • Create charts and graphs using different visualization techniques

  • Design and create reports and interactive dashboards to get meaningful insights

  • Analyze hidden trends and patterns

  • Create and manage datasets

  • Share reports with others using the Power BI service within or outside the organization

In this course,

You will learn data analysis and data visualization using Power Query, M Language, Dax and Visualizations in Power BI. You will learn about Power BI Desktop and its components. Learn how to use the Power Query Editor to connect Power BI to various data sources, learn how to work on the Data Models to get meaningful insights.

You will learn how to work with hierarchies and timeseries to find trends in your data and make accurate forecasts.

We will go from basic to advanced in a step by step process. Each section provides a new data set and exercises that will challenge you so you can learn by immediately applying what you're learning.

Topics you will Learn

  • We will cover 151 Power BI Data Modelling Real Life examples

  • We will cover 5 Multipage Interactive Dashboard projects

You will learn Power BI in a Step by Step Process

  • Learn how to use Power BI Desktop and Power BI Query Editor

  • Learn how to create relationships between related data sources in Power BI

  • Learn to create Power BI Data Models using the Power Query, M Language and  DAX Formula language to create powerful calculations

  • Learn Power BI DAX and how to use it to build custom Measures

  • Use the built in Power BI Q&A feature to easily ask questions regarding your data to get new meaningful insight

  • Learn to create Power BI reports with various types of aggregations and filters

  • Learn to create Powerful Interactive reports and dashboards with drill throughs and relative date filters in Microsoft Power BI

  • Create a wide range of Power BI Charts, Graphs and Visualizations using drag and drop methods from Data Visualization Tools

  • Learn how to use themes and custom visualizations in enhance your reports

By the time you complete this course, you'll be a highly proficient Power BI user.

So what are you waiting for?

Let's get started.

Content

Introduction to Microsoft Power BI Course

An introduction to Microsoft Power BI Course
Download & Install - Microsoft Power BI Desktop
Download - Microsoft Power BI supporting files

Learn Data Analysis & Data Visualization using Power Query, DAX & Visualizations

Overview of Microsoft Power BI Desktop Interface
Microsoft Power BI data sources and how to connect them
Power BI - Connect to data sources like Excel, CSV and Website
Power BI - Connecting to other data sources in Microsoft Power BI
Combine data from multiple excel files - Use Query Editor to reduce data set
Power BI - Power Query Editor - An overview
Power BI - M Query Language - An Overview
Renaming, Editing and Error handling in Power Query advanced editor
Consolidate and add custom data types in Power BI using M formula language
Change data types, replace values, group data, transpose and unpivot
Text column functions (split , format, merge and extract columns)
Append data to a query, Insert custom columns and index column
Build relation between tables, merge data, show and hide queries
How to Lookup tables in a data set using Microsoft Power BI
Adding Text Formulas in Custom Columns and Conditional Formulas
Power BI - Power Query List function
Group by aggregation and find sum by unique column values in Power Query
Power BI - Date Function in Power Query
Power BI - Number Functions in Power Query
Percentage, Percent of, Fill Up and Fill Down in Power Query
Power BI - Add Prefix and Suffix to a Text in Power Query
Power BI - Dynamically Merge Related Data Spilled Out in Different Columns
Power BI - How to GroupBy All Rows in Power Query
3 Ways to Extract Text and Numbers from a string using Power Query
Power BI - How to Reduce row data with Power Query
Power BI - Get Top N records using List .Range function in Power Query
Power BI - IF Error function in Power Query
Power BI - Merge tables based on conditions
Power Query Let and Nested Let statement
Power BI - Create Functions in Power Query - Part 1
Power BI - Create Functions in Power Query - Part 2
Power BI - How to Add Parameters in a Data Table using Power Query
Power BI - Group By Maximum Value in a table using Power Query
How to use Fill Up or Fill Down in your data based on conditions
Power BI - How to Index columns in Power Query to get value of previous row
Power BI - How to do conditional join or conditional merge using Power Query
Power BI - How to use IF Function in Power Query
Power BI - Dynamically change column names using Power Query
How to create a delimited list in Power Query
Power BI - Create Dynamic Start date & End date for data tables in Power Query
Power BI - Match data based on Approximate or Close Match in Power Query
Power BI - How to Combine tables with Different Columns
Power BI - How to work with Nulls or Blank values in Power Query
Power BI - How to create a Dynamic Calendar table in Power Query
Power BI - How to Pivot data in Power Query
Power BI - How to Filter data based on Multiple Criteria using Power Query
How to Summarize and Group data using Power Query
Power BI - Dynamically Rank with Ties in Power Query
Power BI - Find TopN rows in each group using Power Query
Power BI - For Each Group create a Row Number using Power Query
Power BI - Retain recent records and remove duplicate records
Power BI - How to perform VLOOKUP in Power Query
Power BI - Extract Min date & Max date for column category dynamically
How to use SUMIF between two table using Power Query
Power BI - How to add Zeros before Numbers in Power Query
Power BI - Complete Hidden Function List in Power Query
An overview of Power BI Report View (Filters, Visualizations, Fields)
An overview of Visualizations (Text, chart, Cards, Table, Slicer, Filters)
Q&A feature in Microsoft Power BI
An overview of Data Analysis Expressions (DAX) - Data Modeling and Visualization
Power BI - Import data and Create Relationships - Transform data using DAX
DAX Lookup function - Add a calculated column & get details from a lookup field
Create a DAX function with calculated column to find Product of two columns
DAX function with calculated column to Divide & find difference of two columns
DAX Aggregate Functions such as SUM & SUMX
DAX Aggregate Functions such as MIN & MAX
DAX Aggregate Functions AVERAGE
Power BI Data Visualization - Create a Simple Dashboard
DAX COUNT, COUNTA, COUNTAX, COUNTROWS, COUNTX, COUNTBLANK & DISTINCTCOUNT
DAX Logical Functions - AND, OR, NOT, IF, NESTED IF, IFERROR, TRUE, False & SWIT
DAX Text Functions such as COMBINEVALUES, SEARCH, FIND, EXACT and TRIM
DAX Text Functions such as CONCATENATE, REPLACE, LEFT, RIGHT, MID and LEN
DAX Text Functions such as SUBSTITUTE, FIXED and FORMAT
DAX Date Functions such as MINUTE, HOUR, DAY, MONTH, QUARTER, Year
DAX WEEKDAY, WEEKNUM, DATE, TODAY, NOW, CALENDAR and CALENDAR AUTO Functions
DAX Advanced Date Functions - DATEDIFF, DATESBETWEEN and DATESINPERIOD
DAX DATEADD Function
DAX EDate and EOMonth Functions
Calculate MTD, QTD, YTD (Cumulative Total in Power BI)
DAX ISBLANK, ISNUMBER, ISTEXT, ISNONTEXT, ISERROR, ISODD, ISEVEN & ISLOGICAL
DAX Contains Function - Basic and Advanced Function
MONTH, OPENINGBALANCEQUARTER & OPENINGBALANCEYEAR
CLOSINGBALANCEMONTH, CLOSINGBALANCEQUARTER & CLOSINGBALANCEYEAR
DAX such as Function MAX, MAXA, MAXX
DAX Function such as FIRSTNONBLANKVALUE & LASTNONBLANKVALUE
DAX Function such as FIRSTNONBLANK and LASTNONBLANK
DAX Function GENERATESERIES
DAX Function such as EXCEPT, All and ALLEXCEPT
DAX Function such as ALLSELECTED and SELECTEDVALUE
DAX Function such as VALUE, ERROR, IN
DAX Function such as UPPER and LOWER
DAX Function TREATAS
DAX Function HASONEVALUE
DAX Function such as UNION and CROSSJOIN
DAX Function PARENT and CHILD
DAX Function PARALLELPERIOD
DAX Function TopN
DAX Function such as GROUPBY
DAX Logical Function - Data Forecasting
DAX Function such as HASONEFILTER vs HASONEVALUE
DAX Function such as ISFILTERED vs ISCROSSFILTERED
Allocation Calculation using GroupBy, Current Group & Generate
Measures vs Calculated Columns in Power BI
How to fix dates formatted as Text in Power Query
Calculate the SUM of Distinct Values using DAX in Power BI
Dynamic Conditional Formatting for Values & Totals in Power BI
Month & Quarter data comparison using DAX DATEADD & SAMEPERIODLASTYEAR
How to Hide or Unhide Measures using a Slicer in Power BI
How to calculate Cumulative Discount using DAX in Power BI
How to Custom Sort data tables and charts using DAX in Power BI
Create a Data Model with Targets and Goals using Dax in Power BI
Limit Table or Matrix Visualization till user selected date using DAX in Power B
How to calculate Same Period Last Month using DAX in Power BI
How to create an Index based on two or more columns in Power BI
How to calculate MAX and MIN of a measure using DAX in Power BI
Power BI - How to use DAX INDEX function in Power Query
Create Dynamic Pricing model with DAX in Power BI
How to create Virtual Tables in Power BI using DAX
Power BI - Identify uptrend and downtrend in Sales based on a time period
Calculate Quartiles using DAX PERCENTILEX.INC & DAX PERCENTILEX.EXC
DAX Product and DAX PRODUCTX function in Power BI
How to find the age based on Date of Birth in Power BI
DAX ROUND, ROUNDUP, ROUNDDOWN Functions in Power BI
DAX RAND and RANDBETWEEN Functions in Power BI
DAX RANKX Function Static VS Dynamic Ranking in Power BI
How to work with Multiple Fact Tables using DAX in Power BI
Create Smart Narrative Summaries in Power BI
How to create fiscal year or financial year date table in Power BI
Create and use what-if parameters to Visualize Data in Power BI
Create Dynamic Greetings using DAX in Power BI
Calculate Variance (DAX VAR.S) & Standard Deviation (DAX STDEV.S)
Calculate Mean, Median and Mode using DAX in Power BI
How to use DAX PRICE Function in Power BI
How to Forecast data in Power BI - Example 1
How to Forecast data in Power BI - Example 2
How to Forecast data in Power BI - Example 3
Learn different types of charts in Power bi - Part 1
Learn different types of charts in Power bi - Part 2
Learn different types of charts in Power bi - Part 3
Learn different types of charts in Power bi - Part 4
Learn different types of charts in Power bi - Part 5
Create a Funnel chart in Power BI
Create a Scatter chart & Bubble chart in Power BI
Create a Waterfall chart in Power BI
Create Visuals using Power BI Q&A option
How to create a Pareto chart in Power BI
Create a dynamic Gauge chart in Power BI
Create a Decomposition Tree visual in Power BI
Create a Key Influencer visual in Power BI
Better ways to display data in a Matrix visualization in Power BI
How to create a Slope chart in Power BI
How to use report themes in Power BI

Dashboard 1 - Target vs Actual Comparison Dashboard - 1

An overview of Interactive Target vs Actual Comparison Dashboard
Data Modeling using DAX - Create Interactive Dashboard Visuals - 1
Data Modeling using DAX - Create Interactive Dashboard Visuals - 2

Dashboard 2 - Quality Analysis Dashboard - 1

An overview of Interactive Quality Analysis Dashboard
Data Modeling using DAX - Create Interactive Dashboard Visuals - 1
Data Modeling using DAX - Create Interactive Dashboard Visuals - 2

Dashboard 3 - Multipage Digital Marketing Dashboard - 1

An overview of Interactive Multi Page Digital Marketing Dashboard
Data Modeling using DAX - Create Interactive Dashboard Visuals - 1
Data Modeling using DAX - Create Interactive Dashboard Visuals - 2
Data Modeling using DAX - Create Interactive Dashboard Visuals - 3

Dashboard 4 - Interactive Multipage Sales Dashboard - 1

An overview of Interactive Multi Page Sales Dashboard
Import & Transform data from source file
Data Modeling using DAX - Create Interactive Dashboard Visuals - 1
Data Modeling using DAX - Create Interactive Dashboard Visuals - 2
Data Modeling using DAX - Create Interactive Dashboard Visuals - 3
Interactive Multi Page Sales Dashboard - Final Touch

Dashboard 5 - Multipage Human Resource Dashboard - 1

An overview of Interactive HR Dashboard
Import & Transform data from source file
Data Modeling using DAX - Create Interactive Dashboard Visuals - 1
Data Modeling using DAX - Create Interactive Dashboard Visuals - 2

Conclusion

Learning Recap & Thank You note

Screenshots

Power Bi - Master Power Bi with 40+ hours of Premium Content - Screenshot_01Power Bi - Master Power Bi with 40+ hours of Premium Content - Screenshot_02Power Bi - Master Power Bi with 40+ hours of Premium Content - Screenshot_03Power Bi - Master Power Bi with 40+ hours of Premium Content - Screenshot_04

Reviews

Ellen
November 30, 2022
I have just recently started this course but from what I have watched it is very complete, explained in a very easy to understand way with lots of details and visuals. I will update this rating once Im done woth the course.
Aaradhya
November 16, 2022
I am totally dissatisfied with this course. I have buy this course because it had very good content but after that I found out all the videos are recorded in robotic voice. No knowledge at all. Even I am not able to complete this course. I thought that there will be a person who will instruct all the thing and make me understand how and why to do all the task. In this course there was a AI voice throughout all the videos that makes it so boring. Not expected at all. Udemy not providing the refund, the reason being I have watched so many videos but I did not even complete a whole topic. Just watch some videos from one head.
Ramachandra
February 9, 2022
This course is really good, to have a hands on experience, I really appreciate the work you have done to put all the things in one video. I would like to give one suggestion to inculcate requisite notes, as it helps to recall the things whatever, we learn during the course.
Melvin
December 24, 2021
Lot of information to learn. i think i can apply many things to my day to day data analysis work. thanks

Charts

Price

Power Bi - Master Power Bi with 40+ hours of Premium Content - Price chart

Rating

Power Bi - Master Power Bi with 40+ hours of Premium Content - Ratings chart

Enrollment distribution

Power Bi - Master Power Bi with 40+ hours of Premium Content - Distribution chart
4399392
udemy ID
11/16/2021
course created date
1/4/2022
course indexed date
Bot
course submited by