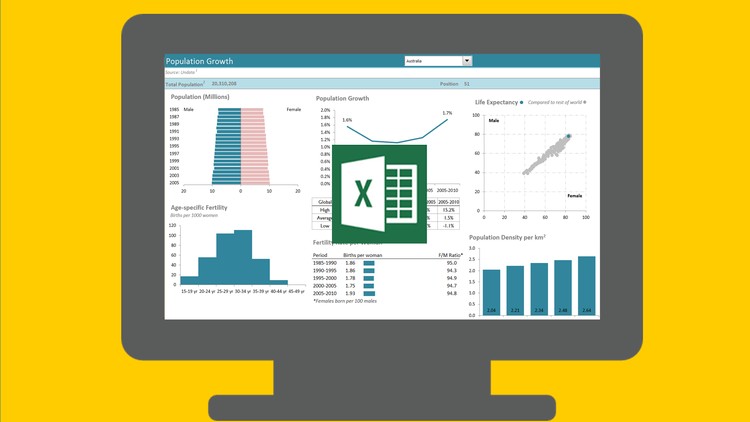
Excel Dashboards in an Hour

Learn how to create interactive Excel Dashboards in one hour. No special add-ins or tools required, just Excel.

4.57 (14617 reviews)
Udemy
platform
English
language
Microsoft
category
instructor
Excel Dashboards in an Hour
167,305
students
1 hour
content
Sep 2017
last update
FREE
regular price

What you will learn

Create Interactive Excel Dashboards that will wow your boss and colleagues.

Be able to build Dashboards that are quick and easy to update, in fact they can update themselves (imagine being able to confidently say that in an interview), at the click of a button if you set them up right (I show you how).

Know which chart to choose for your data.

Why take this course?

📊 **Transform Your Data into Insight with Excel Dashboards in Just One Hour!** 🚀 **Course Instructor: Mynda Treacy** **Course Title: Excel Dashboards in an Hour** --- ### Course Description: Elevate your data analysis skills and become a data hero with our **Excel Dashboards in an Hour** course! Excel Dashboards are a critical tool for visualizing, summarizing, and communicating complex data. They serve as a powerful snapshot of information that can be easily shared across teams, providing key insights at a glance. #### 🌟 Why You Should Take This Course: - **Masterful Techniques:** I've honed these techniques over time and have received outstanding feedback from students who have seen immediate results after just a fraction of the course. - **Real Feedback:** Don't just take my word for it – here's what past students have said: - "I feel like I can save hours!" - Alex - "Your mastery of Excel is impressive. The dashboard presentation was dazzling." - Ben - "This course represented what I had spent days reading about in just one hour. Absolutely amazing!" - Lyn - "This was definitely one of the best courses I've ever taken. Incredibly informative and insightful." - Amanta - **Expert Guidance:** As a seasoned Excel user, you'll be amazed at how quickly you can produce automated dashboards with the skills you'll learn here. --- ### What You'll Learn: - 🔍 **Design and Display Principles:** Learn to design dashboards that are not only functional but visually appealing as well. - 🎮 **Interactive Controls:** Discover how to create interactive elements in your dashboard so users can explore the data for themselves. - ⚡️ **Automating Your Dashboard:** Find out how to set up your dashboards to update automatically, providing real-time insights. ### The Impact of Dashboards: Dashboards are more than just a tool; they're a **storyteller** for your data. They can revolutionize how you handle project management, customer service, retail management, financial forecasting, and much more. With the right skills, Excel Dashboards can provide insight, analysis, and alerts that will make your workflow significantly more efficient. --- ### Course Requirements: - **Excel Version:** Have access to the PC version of Excel 2010 or later. - **Experience Level:** Familiar with creating reports in Excel, including knowledge of basic formulas. Experience with Pivot Tables and Charts is beneficial but not mandatory. --- ### Course Contents & Overview: This course is packed with **9 lectures** and over **1 hour** of content to give you a comprehensive understanding of creating interactive Excel Dashboards. You'll receive the course's Excel Dashboard workbook and PowerPoint presentation, complete with notes for further learning resources. - **Practical Application:** Use the included materials as a practical guide to apply what you learn and as a reference for future projects. - **Advanced Features:** Cover advanced features of Excel Dashboards, including principles for clear dashboard creation, interactive controls, and data automation. ### Upon Completion: You'll have an array of techniques at your fingertips, along with numerous examples that can be tailored to your own datasets. These tips and tricks will enhance your daily Excel work, making you more efficient and effective in analyzing and presenting data. --- Don't miss out on the opportunity to turn your Excel skills into powerful data insights! Enroll in **Excel Dashboards in an Hour** today and start transforming your data storytelling tomorrow. 📈💻 Enroll now and take the first step towards becoming an Excel wizard! 🚀✨

Screenshots

Excel Dashboards in an Hour - Screenshot_01Excel Dashboards in an Hour - Screenshot_02Excel Dashboards in an Hour - Screenshot_03Excel Dashboards in an Hour - Screenshot_04

Our review

--- **Overview of the Course:** The course is designed to introduce users to creating effective dashboards in Excel within a short timeframe. It covers essential features such as Pivot Tables, Slicers, and formulas that are integral to building interactive dashboards. The instruction is delivered in an engaging and clear manner, making it suitable for learners of varying expertise levels. **Pros:** - **Engaging Content:** The course content is enjoyable and well-designed, with a focus on practical skills that can be immediately applied. - **Clear Explanations:** Users appreciate the clarity in which complex features like Pivot Tables and Slicers are explained. - **Interactive Learning:** Many users have successfully followed along and created dashboards simultaneously while learning. - **Efficient Learning:** The course is condensed into just one hour, making it a time-efficient way to learn essential Excel skills. - **Real-World Application:** The course demonstrates how to apply these skills in real-world scenarios, such as tracking company performance or organizing team progress. - **Professional Instruction:** Mynda Treacy is commended for her professional and informative approach to teaching. **Cons:** - **Video Resolution Concerns:** Some users have faced issues with video quality, which affected their learning experience. - **Basic Skills Assumption:** The course assumes a certain level of familiarity with Excel, which might leave beginners feeling overwhelmed without prior knowledge or exercises to practice. - **Data Usage:** There are concerns about the use of ready-made data, which may not reflect the real challenges learners face in their actual work. - **Pacing of Explanation:** While the explanations are clear for intermediate users, they might be too fast for complete beginners. **Additional Feedback:** - **Variety of Learning Styles:** Users appreciate the ability to learn and practice alongside the course content. - **Useful for Various Levels:** The course is helpful for both intermediate users looking to expand their skills and beginners eager to understand Excel dashboards. - **Immediate Application:** Learners have reported being able to use the skills gained immediately in their professional roles. - **Misconception Clarification:** The course helps clear up common misconceptions about dashboard creation and usage. **Conclusion:** Overall, this course receives high marks for its comprehensive coverage of Excel dashboards, effective teaching methods, and practical approach to learning. While there are some technical issues to address and a need for varied pacing, the course remains a valuable resource for anyone looking to enhance their data visualization skills with Excel. The positive feedback from users underscores the course's effectiveness and the value it provides in a concise and efficient manner. --- **Course Rating:** 4.58/5 (Based on recent reviews) **User Experience Summary:** - **Positive Experience:** A significant majority of users have had a positive experience with the course, citing its clarity, practicality, and engaging content. - **Room for Improvement:** Some users point out areas that could be improved, particularly regarding video resolution and instruction pacing to accommodate different skill levels. - **Highly Recommended:** Users across the skill spectrum recommend this course as a helpful tool for creating dashboards in Excel.

Charts

Price

Excel Dashboards in an Hour - Price chart

Rating

Excel Dashboards in an Hour - Ratings chart

Enrollment distribution

Excel Dashboards in an Hour - Distribution chart

Related Topics

926630
udemy ID
8/9/2016
course created date
6/11/2019
course indexed date
Bot
course submited by