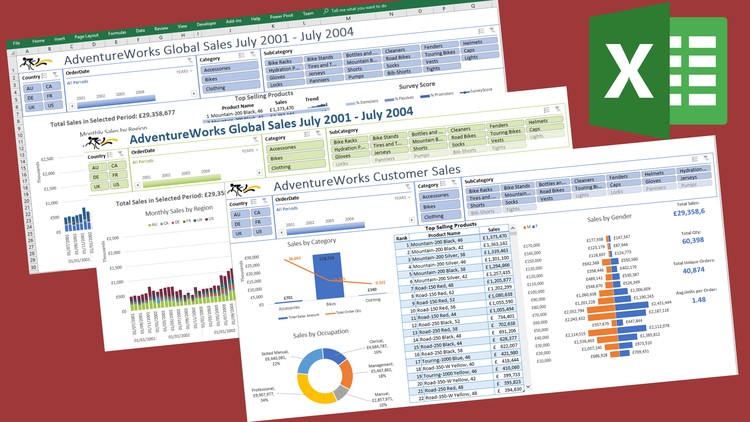
DAX Dashboard Design - 10 Easy Steps
How to Create Interactive Business Intelligence Dashboard Reports with DAX Power Pivot
4.66 (127 reviews)

1,107
students
5.5 hours
content
Mar 2019
last update
$64.99
regular price
What you will learn
Plan, plot, build fully interactive, dynamic Dashboard Reports
Adapt to scenarios where data doesn't "fit" the brief
Create "Negative" Bar & Column Charts
Create "Scrollable" tables when space is limited
Record a Macro and edit VBA code to automate Sparklines
Related Topics
1691518
udemy ID
5/14/2018
course created date
3/27/2020
course indexed date
Bot
course submited by