Data Visualization & Data Wrangling Masterclass with Python

Master Advanced Data Visualization, Data Preprocessing, Data Wrangling in Python with Industry Level Projects

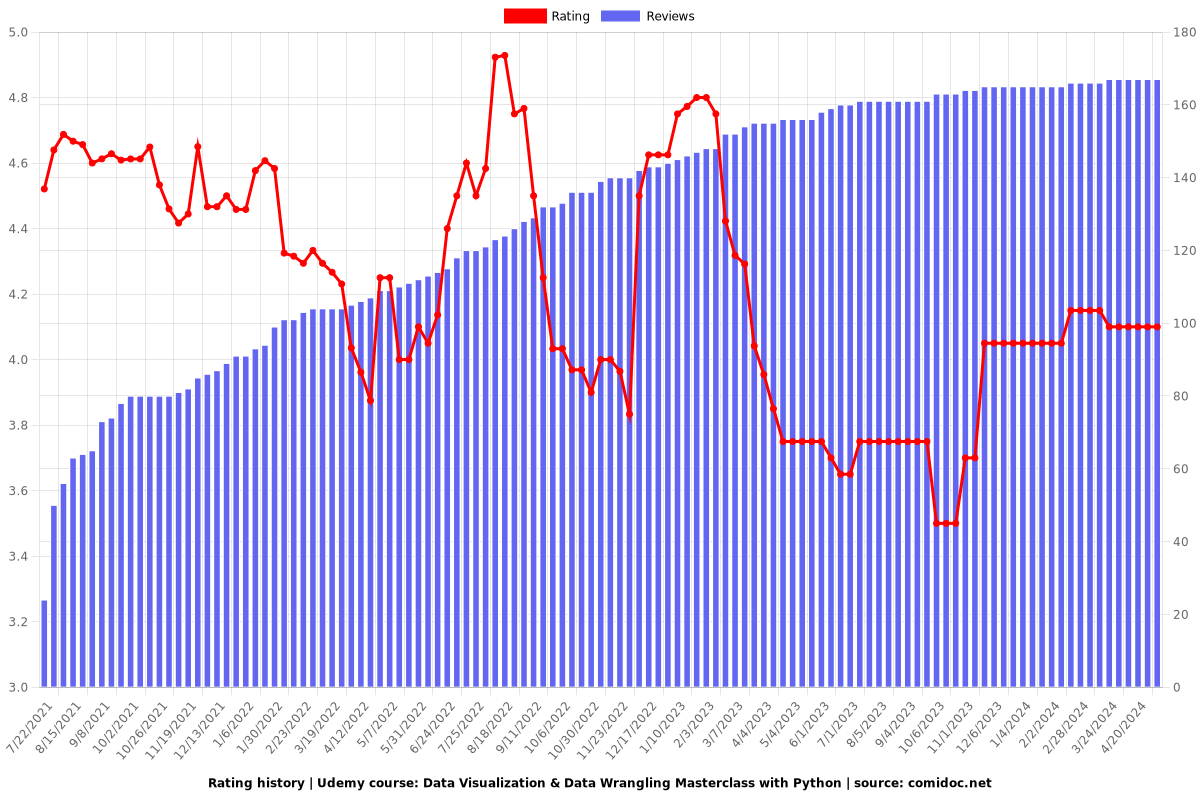
4.10 (167 reviews)
Udemy
platform
English
language
Data Science
category
Data Visualization & Data Wrangling Masterclass with Python
24,131
students
9.5 hours
content
Mar 2022
last update
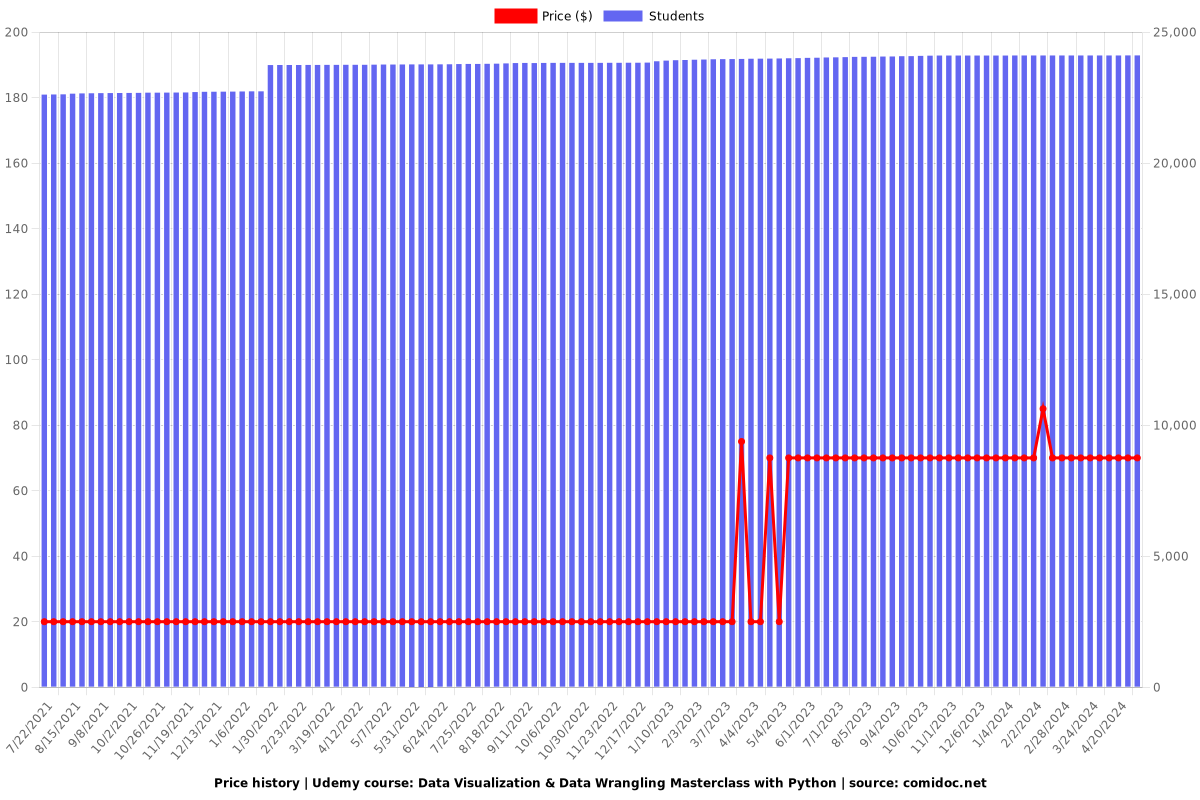
$69.99
regular price

What you will learn

Learn about python variables and data types.

Learn how to apply loops and conditionals in python.

Learn how to work with python strings.

Learn about Regular expressions and date time objects in Python.

Learn about the Numpy and the Pandas library.

Learn about Univariate, Bivariate and Multivariate Analysis.

Learn about advanced visualization such as facet grids, polar charts, waffle charts, maps, statistical charts etc.

Learn about animated visualizations such as bubble plot, facets, scatter maps and choropleth maps.

Learn about some more miscellaneous charts such as sunburst charts, parallel-coordinate charts, gantt charts etc.

Learn exploring data using Dabl and Sweetviz library.

Learn about working on real-world projects.

Create a variety of charts.

Why take this course?

Welcome to the online course on Data Visualization.


Data Visualization is a graphical representation of information and data.

Data Visualization tools provide an accessible way to see and understand data because with visualizations it becomes easier for the human brain to understand and pull insights out of the data.


The primary goal of a data analyst is to increase efficiency and improve performance by discovering patterns in data.


In this course, you will get advanced knowledge on Data Visualization.

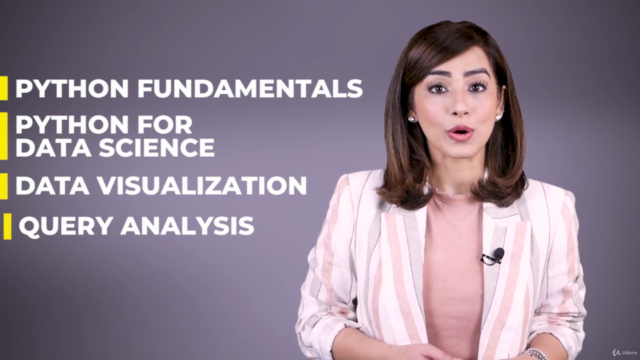
This course begins with providing you the complete knowledge on Python programming language.

You will learn all the concepts of python programming required.


This course will cover:-

  • Python variables.

  • Python data types.

  • Loops and Conditionals.

  • Strings.

  • Regular Expressions.

  • Data Time Objects.

  • Numpy Library.

  • Pandas Library.

  • Data Visualization using Python

  • Query Analysis.


Along with python programming, this course will cover the concepts of query analysis as well.

That will help you become an expert in analyzing data using different libraries such as Dabl and sweetviz.

Not only this, this course will provide advanced knowledge on Data Visualization.

This course will cover:-

  • Basic data visualization

  • Advanced-Data Visualization such as facet grids, polar charts, waffle charts, maps, statistical charts etc.

  • Animated Data Visualization such as bubble plot, facets, scatter maps, and choropleth maps.

  • Some miscellaneous charts such as sunburst charts, parallel-coordinate charts, Gantt charts, etc.


All this in one course!!!!


Along with all these, we have three bonus projects for you!

  • Startup Case study and Analysis.

  • Player performance Reviewer, and

  • IPL Data Science Analyzer.


Where you will apply all the concepts learned in this course.

This course is a complete package. Lots and lots of quizzes and exercises are waiting for you.


You will also have access to all the resources used in this course.

Instructor Support - Quick Instructor Support for any queries.

I'm looking forward to see you in the course!


Enroll now and become an expert in data visualizations.

Screenshots
Data Visualization & Data Wrangling Masterclass with Python - Screenshot_01Data Visualization & Data Wrangling Masterclass with Python - Screenshot_02Data Visualization & Data Wrangling Masterclass with Python - Screenshot_03Data Visualization & Data Wrangling Masterclass with Python - Screenshot_04

Reviews

Christian
March 23, 2023
Missing documents, more interested in talking about the topics that they use as examples rather than Data Science techniques and the code itself. The videos start with 45 seconds of filler and end with more filler. You get more information from simply googling the topic of the video and following W3 or StackOverflow
Jesse
February 17, 2023
The content in the first half of this course is simple explanations followed by difficult problems followed by the material need to solve the problems a few sections later. The materiel in the second half of the course is good, although new seaborn methods have to be looked up online.
Shubhanshu
December 4, 2022
This course is awesome. The content was very well demonstrated. This was a fantastic and interesting course with clear examples and it is explained in simple, easily understandable format. Excellent information for people who wants to present data clearly. I found it very useful course and helped me to understand a lot of details. Highly recommend!
Arjun
November 7, 2022
Very informative course! Excellent for beginners. I learn about how to visualize graphs and create a powerful visualization. It is really helpful to understand the importance of data visualization. The points are nicely presented and well articulated. Highly recommend.
Lorrinda
September 15, 2022
Concepts are not explained well, if at all. Quizzes and activities ALWAYS include 50% of the questions about or using something that hasn't been taught in the course.... yet. I'm starting to see that she eventually gets around to teaching the things she expects people to know-- just not until a few videos after she wants you to use it. Even in the videos where she goes over the answers/solutions to quiz/activity-- she just shows what she typed. She doesn't explain the logic behind it so that someone not knowing about the subject can learn anything... so unless your "real life interview questions" are for the same exact scenario that she wants you to copy and paste, you'll probably be out of luck. Also, she's starting to reference files she wants the class to use-- but she doesn't include the files for download. Multiple students have asked for the datasets, it looks like most of the posts are unanswered. Isn't the WORST course on Udemy, but it isn't good. UPDATE: once you hit the visualization section, you get another instructor. She is better at explaining some things than the previous one was. Atleast she lets you know which modules you'll need to import from the library before an exercise (which the first instructor hardly ever did). So I'll update to 3 full stars from 2.5
Arslan
August 7, 2022
As I have previous experience with different programming languages and I already know how to code in python this course is excellent for me. Without wasting any time I can directly jump into learning what is only essential in Data Visualization. some topics are lacking depth, but if you feel that you want to learn more about that topic you can always go to YouTube. But, for perspective on data visualization, I must recommend taking this course as a Road map of your journey. Just don't skip quizzes and Assignments.
Arun
August 1, 2022
Great hands-on course for Data Visualization in Python! This course has been so interesting! The teaching style is very clear and straightforward. Exercises are very useful, it helps in learning methods easily. I highly recommend the course.
Rida
July 12, 2022
A great hands-on course for Data Visualization in Python! The course is very interesting to pay attention to the point of observation, details. This course explains the practical use of various libraries in python for data analysis. I highly recommend the course.
Nazir
June 30, 2022
Excellent for beginners. I enjoyed every bit of the course as it helped show me the basic principles of data visualization. After completing this course my visualizations are so much better now!
Shivam
June 26, 2022
Extraordinary course. This course is an eye-opener for me. The topics were explained very deeply. Each and everything in the course was understood. The instructor is very knowledgeable. I would recommend it to anyone who wants to understand python data visualization.
Rohan
July 21, 2021
it was great to learn new things. Awesome examples, nicely explained topics and all. thanks to course coordinator
Praveen
July 16, 2021
Thanks for this course. Its really helpful for my studies and carrier. This course covered from basic concepts of python to data visualization. I enjoyed in this course and learned lots of concepts.

Charts

Price

Data Visualization & Data Wrangling Masterclass with Python - Price chart

Rating

Data Visualization & Data Wrangling Masterclass with Python - Ratings chart

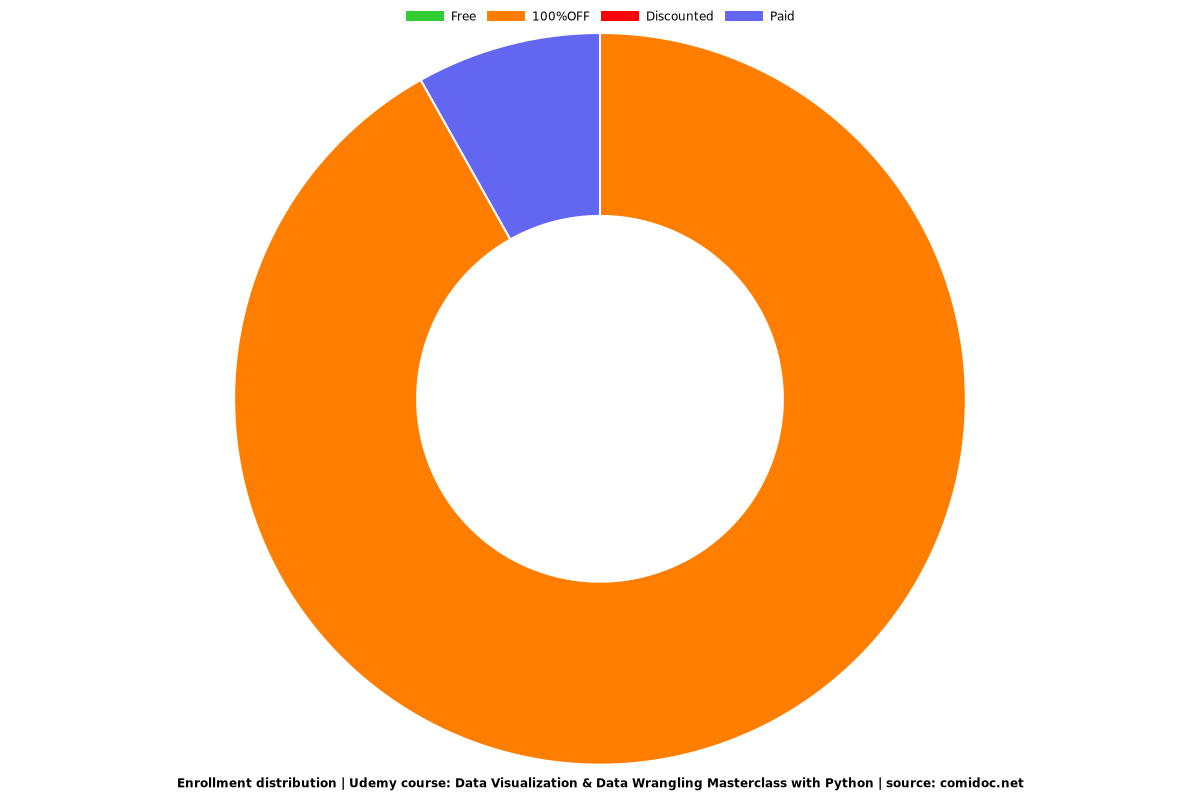
Enrollment distribution

Data Visualization & Data Wrangling Masterclass with Python - Distribution chart

Coupons

DateDiscountStatus
7/16/2021100% OFF
expired
7/17/2021100% OFF
expired
1/25/2022100% OFF
expired
4169522
udemy ID
7/7/2021
course created date
7/14/2021
course indexed date
Bot
course submited by