Mastering Data Visualization with R

Visualize data using R Base Graphics, Lattice Package and ggplot (GGPlot2) for data analysis and data science

4.55 (500 reviews)
Udemy
platform
English
language
Data & Analytics
category
Mastering Data Visualization with R
4,008
students
6 hours
content
Sep 2021
last update
$74.99
regular price

What you will learn

Understand what plots are suitable for a type of data you have

Understand the data before you make a plot

Visualize data by creating various graphs using R base package, lattice and ggplot2 packages

A case study to select a diamond - to explain ggplot()

Why take this course?

This course will help you draw meaningful knowledge from the data you have.

Three systems of data visualization in R are covered in this course:

A. Base Graphics    B. Lattice package  C. GGPlot2


A. Types of graphs covered in the course using the base R package:

Single Continuous Variable:  Histogram, Density Plot, Box-Whisker Plot 

Single Discrete Variable: Bar Chart 

Two Continuous Variable: Scatter Plot

Two Variable: One Continuous, One Discrete: Box-Whisker Plot, Pie Chart, Dot Chart, Strip Chart 

Two Variables: Both Discrete: Mosaic Plot, Stacked Bar Plot       

Time series: Line Charts


B. Types of graphs covered in the Lattice package:
Histogram, Density Plot, Box-Whisker Plot, Bar Chart, Scatter Plot, Dot Chart, Strip Chart


C. Graphs covered in GGPlot2 package:
In this section you will learn about 7 layers in ggplot() and how to use these. In addition there is a project of selecting a diamond from the dataset  of 54000 diamonds, based on my budget.

Commonly Used Graphs: Histogram, Density Plot, Box-Whisker Plot, Bar Chart, Scatter Plot, Dot Chart, Strip Chart


What are other students saying about this course?

  • Very thorough. Covers all the details without glossing over anything. Good consistent pace and nice short segments. Very diligent in always saying what keys he was pressing during the demos, which is often overlooked. Excellent course. (5 stars by Roger Holeywell)

  • Explanations are clear and coherent. This course is well structured and very-very useful. Thank you so much for your help! (5 stars by Martina Katalin Szabó)

  • Todos os cursos oferecidos pelo Prof. Sandeep Kumar na Udemy são excelentes, especialmente em análise e visualização de dados.(5 stars by Jose Maria Nogueira da Costa )

Screenshots

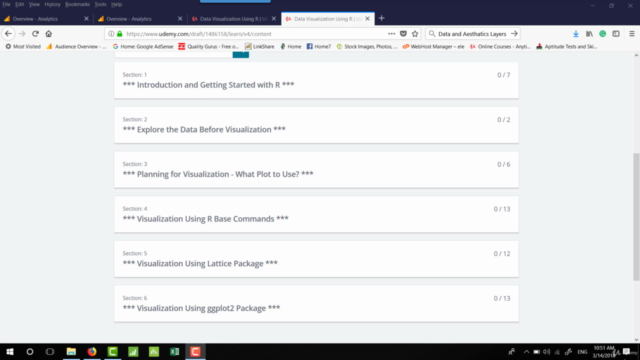
Mastering Data Visualization with R - Screenshot_01Mastering Data Visualization with R - Screenshot_02Mastering Data Visualization with R - Screenshot_03Mastering Data Visualization with R - Screenshot_04

Reviews

Hank
July 3, 2023
Instructor is extremely patient, and he explains things very, very well. I learn something new AND unexpected in every video!
Jmal
December 8, 2022
Generally, yes but in particular, ggplot2 was my reason of going for this course and I will yet get to see it soon.
Elisa
May 19, 2022
Il corso è adatto a tutti, anche a chi ha poca dimestichezza con R. Consiglio vivamente il corso. L'insegnante, preparatissimo, mette tutto a disposizione, spiega lentamente e con molta chiarezza (ho preso quasi tutti i suoi corsi infatti!).
Gabriele
March 30, 2021
You really learn how to build graphics in R with packages ggplot2, lattice and R base. Very engaging and clear step by step explanations. I have attended to other courses of mr. Sandeep Kumar and I like his style of teaching. I would have appreciated a little more section with advanced graphics with ggplot2, but the course let you very able on how to look for help. Very recommended.
Axel
June 10, 2019
A very nice overview on how to visualize data using the base, lattice and ggplot2 packages in R. I enjoyed it a lot - Thank you very much indeed, Sandeep!
Anonymized
September 11, 2018
Would prefer that you reference a different course to learn the basics of R. Have been fast forwarding thru to get to what I'm looking for. Also, starting and ending of each video takes a few seconds more than I'd prefer. Hope that helps.
Chunki
July 29, 2018
Great course! Excellent explanation of the R visualization language. The best part is the breaking down of the various components of ggplot2 as compared to lattice and base R. This is the course if you like to understanding ggplot2 clearly.
Jose
June 23, 2018
Todos os cursos oferecidos pelo Prof. Sandeep Kumar na Udemy são excelentes, especialmente em análise e visualização de dados.
Stephanie
June 19, 2018
Overall, the instructor provided very clear instructions on the topic. It is a very good course who did not have understanding of ggplot2. I would recommend this course for a good foundation of ggplot2. For someone who knows about ggplot2, a more advanced course is better. The section on creating a pie chart could have more details on the mechanism of how ggplot2 creates the pie chart.
Lesley
June 18, 2018
Excellent lectures and systematical learning experience. This instructor actually answers your questions before you have time to think about them.
Cynthia
June 9, 2018
Overall the course is quite good. However, as with most tutorials, the mtcars, diamonds, and iris datasets are overused making it a chore to remain engaged.
Hilalcoban
March 29, 2018
I all the time love this instructor ' courses. he always does a great job. Thank you for this video as well. I learned a lot from his classes for r programming
Yagya
March 25, 2018
He knows his stuff not just as a coder but as an experienced Statistician. He has domain knowledge as well. With this combo, he is an example of experienced data scientist. I will definitely take more courses of him. Keep adding more courses especially in areas of Regression, time series and forecasting.
Debasis
March 23, 2018
Awesome tutorial about data visualization. Covers most of the stuffs in a systematic approach . Thanks for a wonderful tutorial on data visualization. Looking forward for many such courses related to data science.
Sumit
March 18, 2018
Great course for learning visualization techniques. I am am proficient in STATA and believe that R is just better when it comes to plots and graphs. I found this course extremely useful. I believe that this course is especially useful for those who have little or no experience with R.

Charts

Price

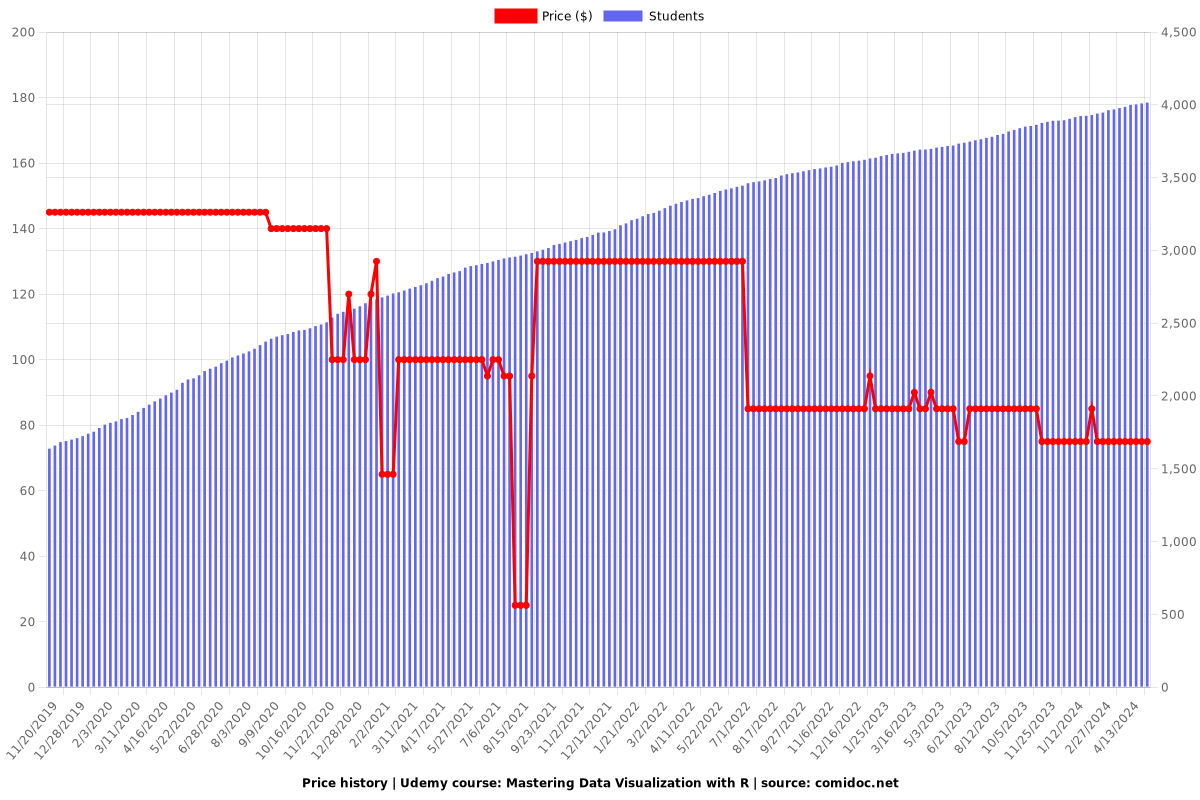
Mastering Data Visualization with R - Price chart

Rating

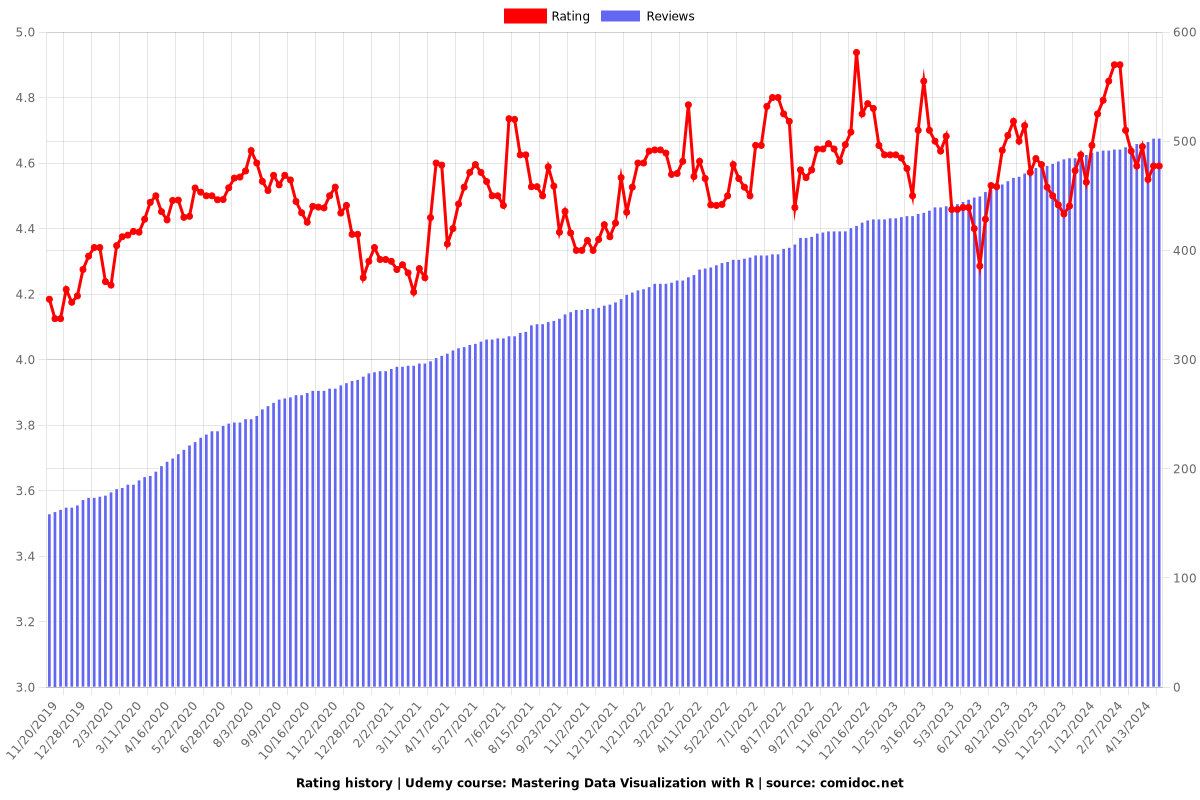
Mastering Data Visualization with R - Ratings chart

Enrollment distribution

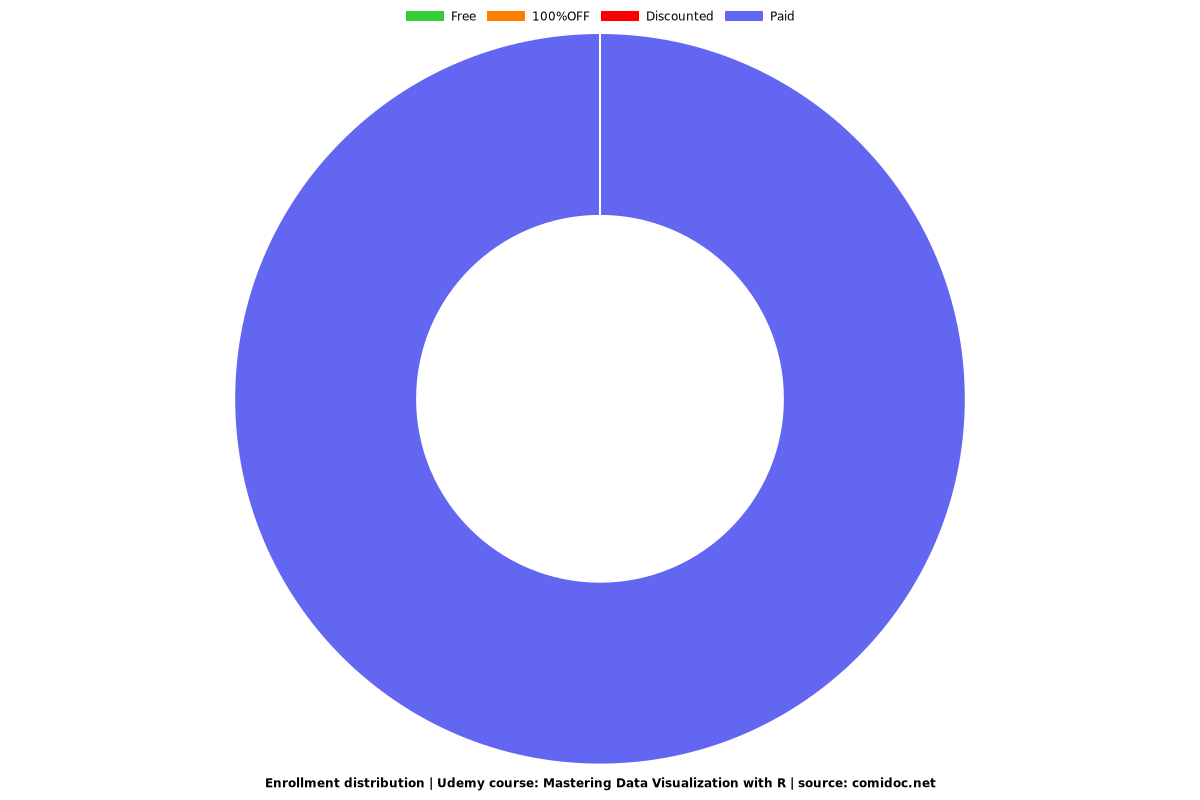
Mastering Data Visualization with R - Distribution chart
1486158
udemy ID
12/29/2017
course created date
11/20/2019
course indexed date
Bot
course submited by