Build Data Visualizations with D3.js & Firebase
Learn how to use D3 (v5) & Firebase (Firestore) to create dynamic SVG data visualizations. Bar charts, pie charts...
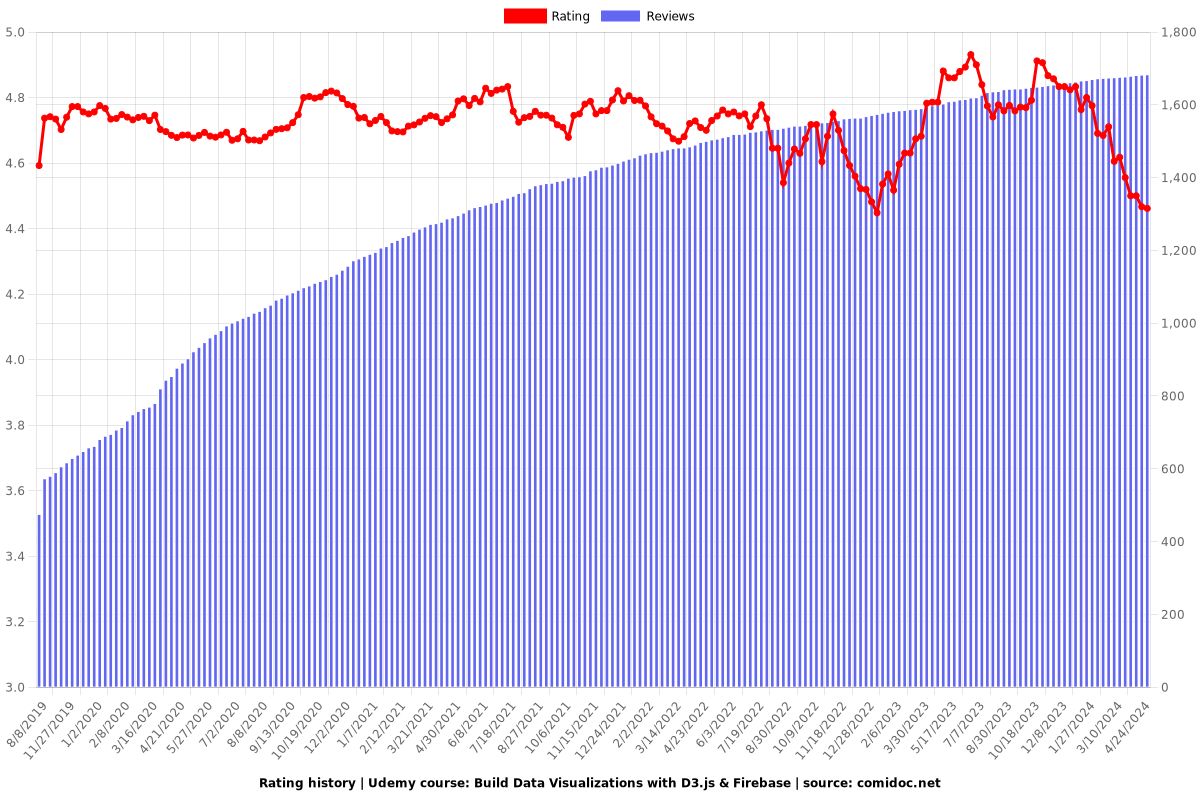
4.47 (1682 reviews)

17,824
students
10.5 hours
content
Sep 2021
last update
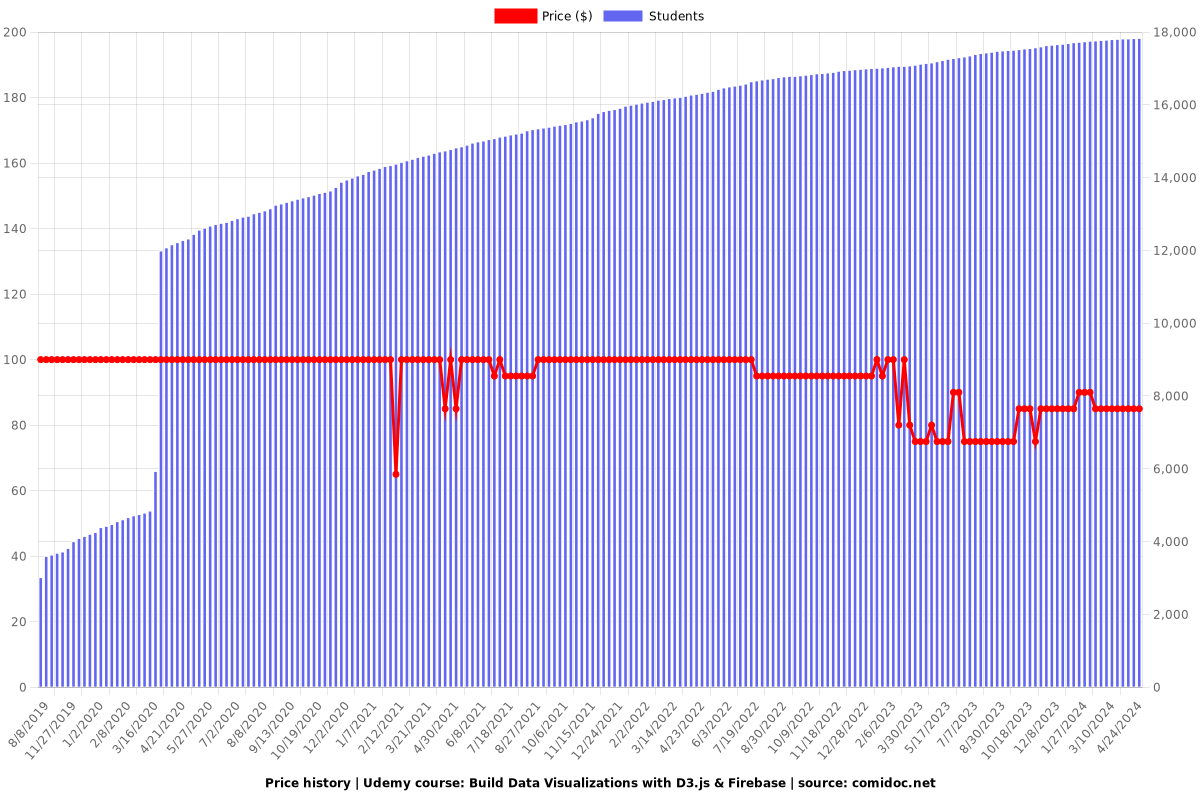
$84.99
regular price
What you will learn
Learn D3 JS & Firebase (Firestore) from the ground up
Create data-driven visualizations (graphs, charts, diagrams) with D3 JS
Store (and retrieve) data in a real-time database called Firestore (from Firebase)
Updata data visualizations in real-time with Firestore
Create 3 projects with D3 and Firebase (Firestore)
Why take this course?
🚀 **Course Headline:**
Unlock Your Data's Potential with D3.js & Firebase: Create Stunning Visualizations! 📊✨
---
**Course Title:**
Build Data Visualizations with D3.js & Firebase
---
**Course Description:**
Dive into the World of Data Visualization with D3.js and Firestore
Are you ready to transform raw data into captivating visual stories? With "Build Data Visualizations with D3.js & Firebase," you'll learn how to create dynamic and interactive SVG-based charts using D3.js (version 5) and real-time updates with Firestore by Google Firebase.
🔍 **What You'll Learn:**
- **Mastering D3.js**: Understand the core concepts of D3 select, manipulating SVG attributes and styles, and how to apply transformations with transitions.
- **Scales & Axes**: Get to grips with scales to map data values to screen coordinates and create attractive axes for your charts.
- **Data Visualization Techniques**: Explore various types of visualizations, including bar charts, pie charts, line graphs, bubble packs, and tree diagrams.
- **Real-Time Updates with Firestore**: Learn how to connect and synchronize your D3.js visualizations with Firestore's real-time NoSQL database.
- **Interactive & Dynamic Visualizations**: Make your visualizations interactive and engaging by handling user input and updating charts in real-time.
⚫️ **Hands-On Projects:**
- **Ninja Wonga**: A money planner that puts your financial data in a visually compelling format.
- **The Dojo**: A fitness tracker to visualize health data with clarity and impact.
- **Ninja Corp**: A detailed employee tree diagram that showcases organizational structure in an intuitive, hierarchical view.
🎓 **Why 'Net Ninja'?**
With over 200,000 subscribers and nearly 1,000 free development tutorials on YouTube, I'm The Net Ninja (Shaun Pelling) - your guide through the intricate world of web development. My teaching style is clear, concise, and accessible for learners at all levels. Before diving into this course, why not check out my channel and see how I can help you on your learning journey? 🥷👍
---
**What's Inside:**
- **Comprehensive Curriculum**: A structured approach to learning D3.js and integrating it with Firestore.
- **Code Samples & Resources**: Access to starter code, sample datasets, and additional resources.
- **Interactive Exercises**: Apply what you've learned through hands-on projects that challenge you to think like a data visualization expert.
- **Community Support**: Join a community of fellow learners and engage in discussions, ask questions, and share your successes!
🎯 **Who This Course Is For:**
This course is designed for web developers and enthusiasts who want to enhance their skills with data visualization and real-time updates. Whether you're new to D3.js or looking to expand your knowledge of Firebase, this course will provide you with the tools and techniques necessary to create visually stunning and interactive data visualizations.
---
Ready to become a Net Ninja and turn your data into stories that engage and inform? Enroll in "Build Data Visualizations with D3.js & Firebase" today and start your journey towards mastering data visualization! 🌟📈
Our review
🌟 **Course Review for D3.js with Shaun Pelling** 🌟
### Overall Rating: 4.5/5
**Pros:**
- 🚀 **In-depth Explanation**: The instructor, Shaun Pelling, goes into great detail explaining each method and concept within the D3 library, ensuring a comprehensive understanding for learners of all levels.
- 🎓 **Patient and Structured Teaching**: Shaun's approach to teaching is patient and systematic, making complex concepts easier to grasp. His pace is perfect for learning, and his energy makes technical content engaging.
- 🛠️ **Project Variety**: The course includes a wide variety of projects, from basic graphs to more complex tree diagrams, providing learners with a diverse range of applications.
- 🌍 **Global Appeal**: Content is presented in English and Spanish, making it accessible to a wider audience.
- 🤝 **Engaging Community**: The community, including Shaun and the teaching assistant, Zhenmao, is very responsive, offering quick assistance with any questions learners may have.
- ✨ **Real-world Application**: The course not only focuses on theoretical knowledge but also on practical applications, which is essential for real-world problem-solving.
- 🛠️ **Introduction to Firestore**: The course provides a good introduction to Firestore, which is beneficial for those looking to build full applications rather than just static charts.
**Cons:**
- ⏳ **Content Updates Needed**: Some reviews mention that the content may be slightly outdated and that learners should be prepared to update the code to the latest versions of d3 (v6/7).
- 📝 **Documentation Adaptation**: While the explanations are clear, some learners found the documentation style a bit verbose or overly simplistic for more experienced developers.
- ⚠️ **Assumed Knowledge**: There is an assumed level of JavaScript knowledge, which might be challenging for beginners not coming from a programming background.
- 🛠️ **Partial Project Guidance**: Some sections may lack comprehensive backend demonstrations and rely on Backend as a Service (BaaS) setups, which could leave learners with questions about full-stack integration.
### Additional Notes:
- The course is highly recommended for beginners, and even experienced programmers have found value in its content due to Shaun's clear explanations and detailed approach.
- Section 13-15 in the latter part of the course contain useful tips that could be beneficial to review before delving into section 5.
- It is recommended for future users to stay updated with d3's latest versions and possibly refer to sections 13-15 early on to avoid potential roadblocks.
### Final Verdict:
This course is an excellent resource for anyone looking to learn D3.js, from complete beginners to those looking to solidify their understanding of data visualization with JavaScript. The comprehensive nature of the course, combined with Shaun's engaging teaching style and a supportive community, make it a standout offering on Udemy. Just be sure to stay current with D3.js updates to ensure the best learning experience.
Charts
Price
Rating
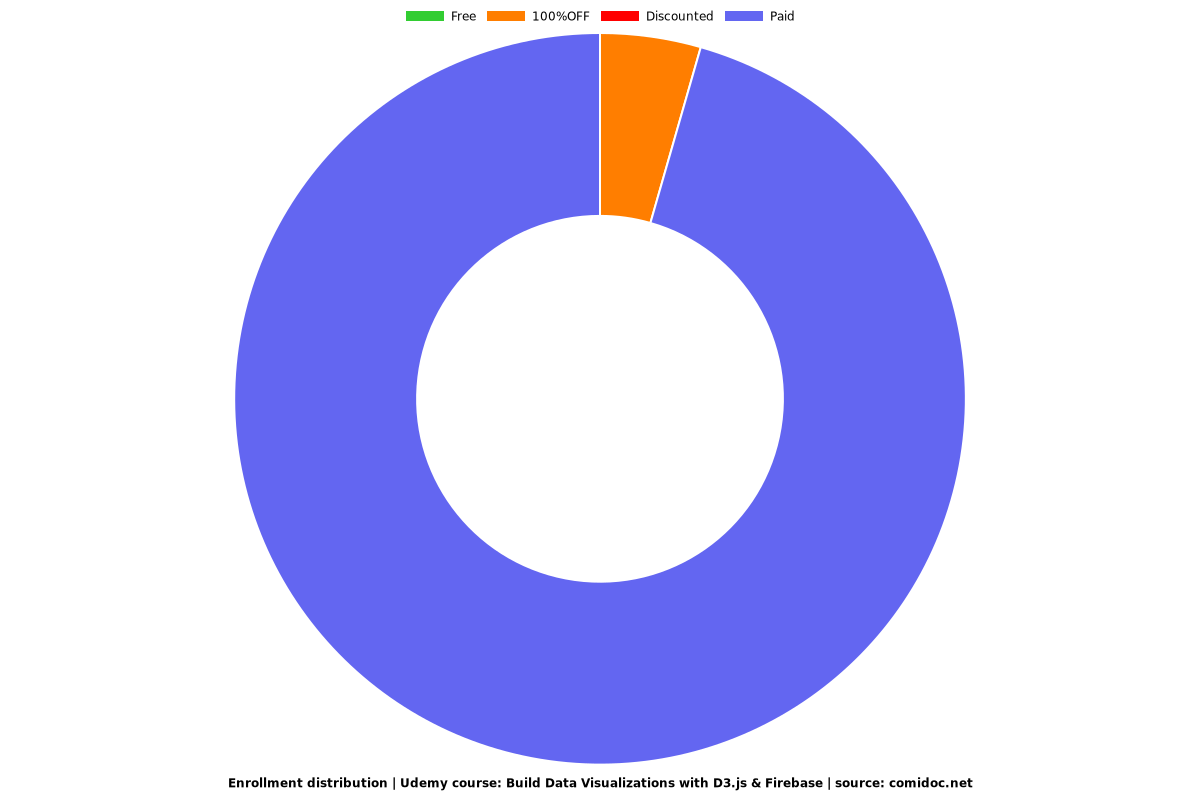
Enrollment distribution
Related Topics
1918908
udemy ID
9/18/2018
course created date
8/8/2019
course indexed date
Bot
course submited by