Statistics Unveiled: From Data Collection to Presentation
A Comprehensive Guide to Understanding and Visualizing Information

What you will learn
What is the meaning of statistics?
What is difference between Primary data and Secondary data?
What are the various ways and means to collect data?
How we can present data with the help of tables?
What are the various applications of statistics?
Why take this course?
1. Data permeates our lives, presenting us with numerical facts and figures that shape decisions in personal, professional, and public contexts.
-2. Understanding data, or information, is crucial for interpreting the world around us and making informed decisions.
-3.Statistics is the branch of mathematics that extracts meaningful patterns and trends from data to inform and guide decision-making processes.
-4.The term "statistics" can refer to both the collection, analysis, interpretation, presentation, and application of data (data statistics) and to the discipline that uses mathematical methods to create models of phenomena (inferential statistics).
-5.Statistics involves analyzing all types of data to draw conclusions and make predictions about populations.
**Day-to-Day Data Collection Examples:** -- Sales records from a retail store
- Health and fitness tracker data
- Online user engagement statistics on social media platforms
- Customer satisfaction surveys
- Website traffic analytics
7.Primary data refers to original data collected directly for a particular purpose or study.
-8.Methods of collecting primary data include surveys, observations, experiments, and simulations.
-9.Secondary data is information that has already been collected by someone else for another purpose.
-10.Sources of secondary data include academic papers, government reports, industry studies, and existing databases.
-11.Primary data provides firsthand information tailored to your specific research question, while secondary data offers a broader perspective but may be less precise.
**After Data Collection:** -12.Once data is collected, the next step is to clean and process it to prepare for analysis.
-13.Presenting data involves transforming raw data into a format that can be easily understood by others.
**Data Presentation:** -14.In scenarios where data volumes are large, presenting data in ascending or descending order manually can be quite time-consuming and prone to error.
-15.An ungrouped frequency distribution table lists each frequency without grouping them based on ranges.
- *Example:* A survey of ages might simply list the number of respondents in each year, from 1 to 100. -16.A grouped frequency distribution table categorizes data into intervals or groups for easier interpretation.
- *Example:* The same age survey could be presented as "0-18", "19-35", etc., showing the number of respondents in each age range. -17.Here's a grouped frequency distribution table example with the new student addition:
| Weight Range (kg) | Number of Students | |---------------------|----------------------| | 30-50 | 30 | | 51-70 | 20 + 1 = 21 | **Statistics Across Fields:** -Statistics is an indispensable tool across numerous fields, including economics, medicine, environmental science, sports, and beyond. It allows professionals to make sense of the vast amounts of data they collect, enabling them to draw meaningful conclusions, predict trends, and optimize decision-making processes.
Join us in "Statistics Unveiled" to transform your approach towards data – from collection to presentation – with confidence and clarity. Enroll now and turn data into a compelling story that informs, influences, and inspires! 📈💡Reviews
Charts
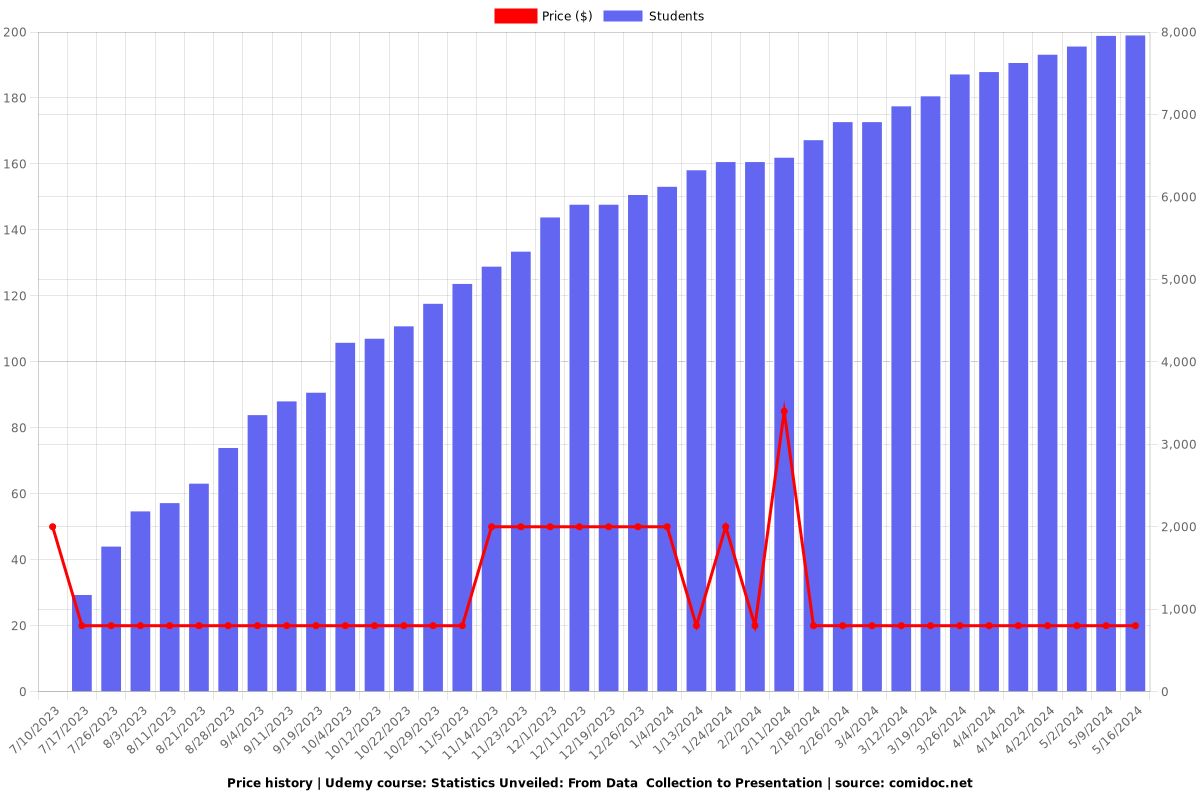
Price
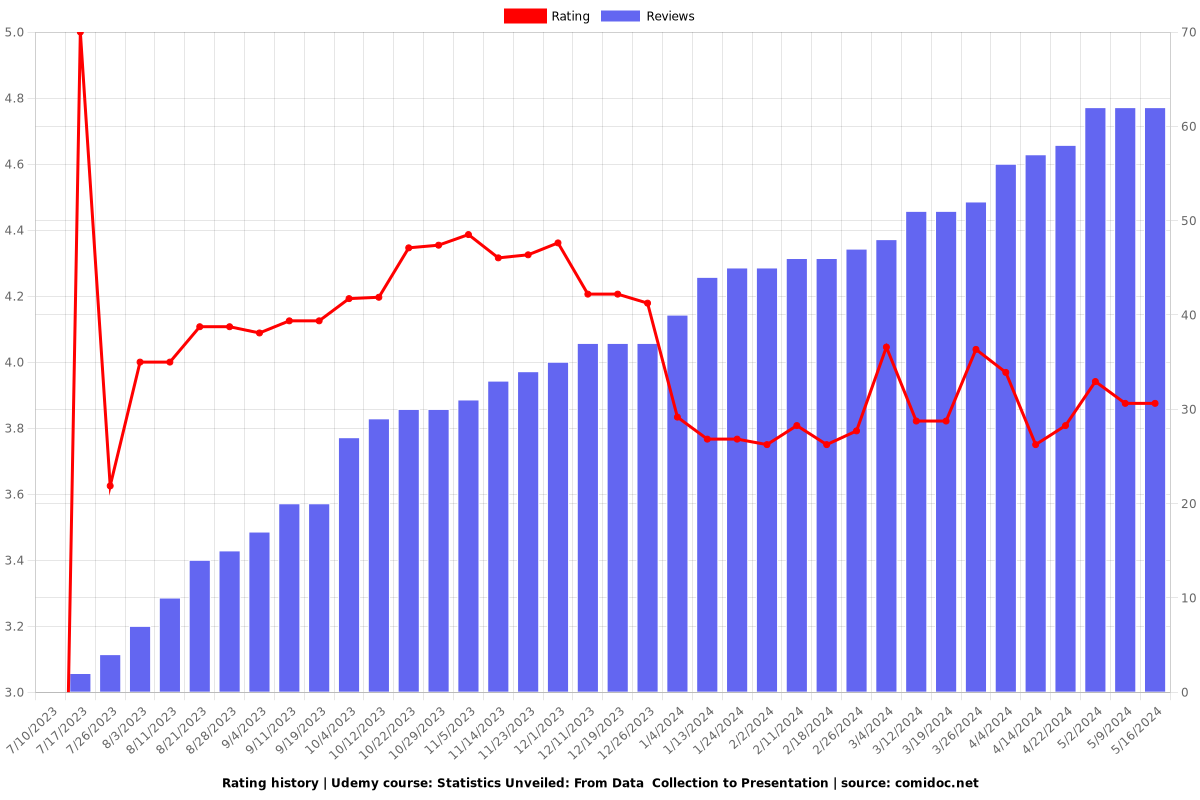
Rating
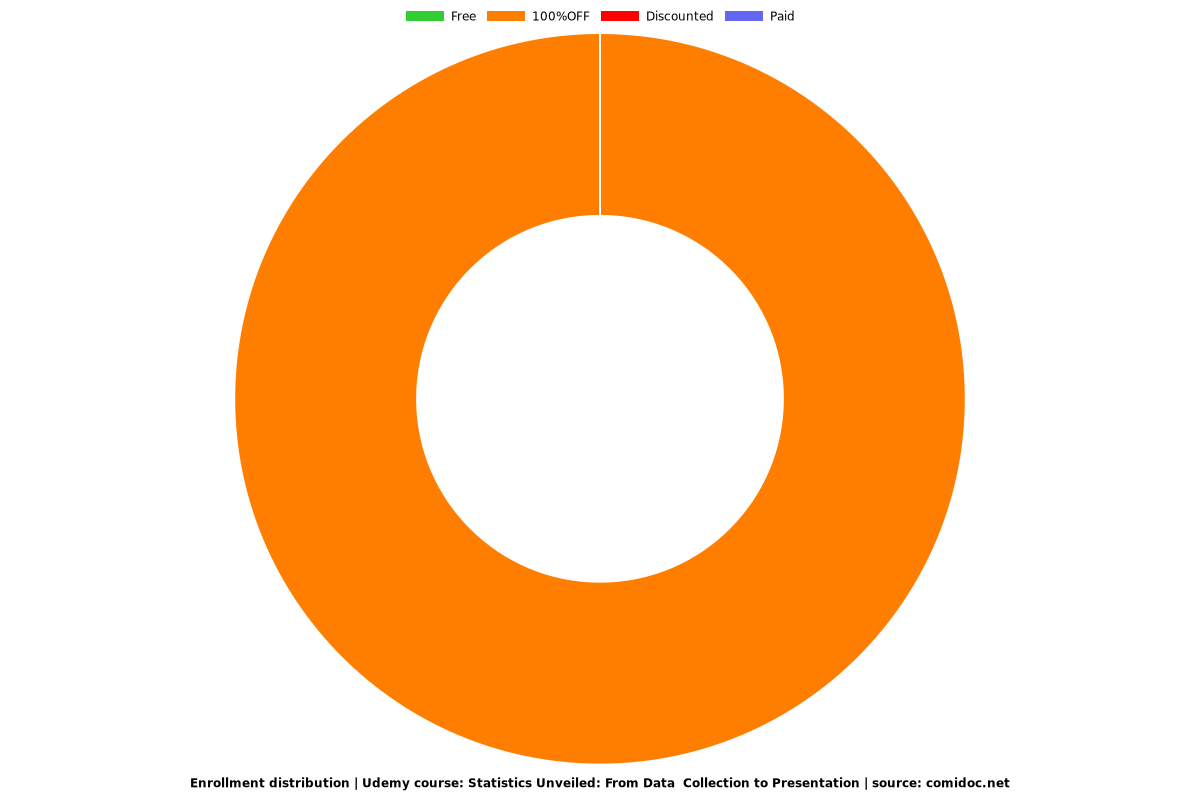
Enrollment distribution