Histograms and Frequency Polygons Demystified
Understanding and Creating Visual Representations of Data Frequency
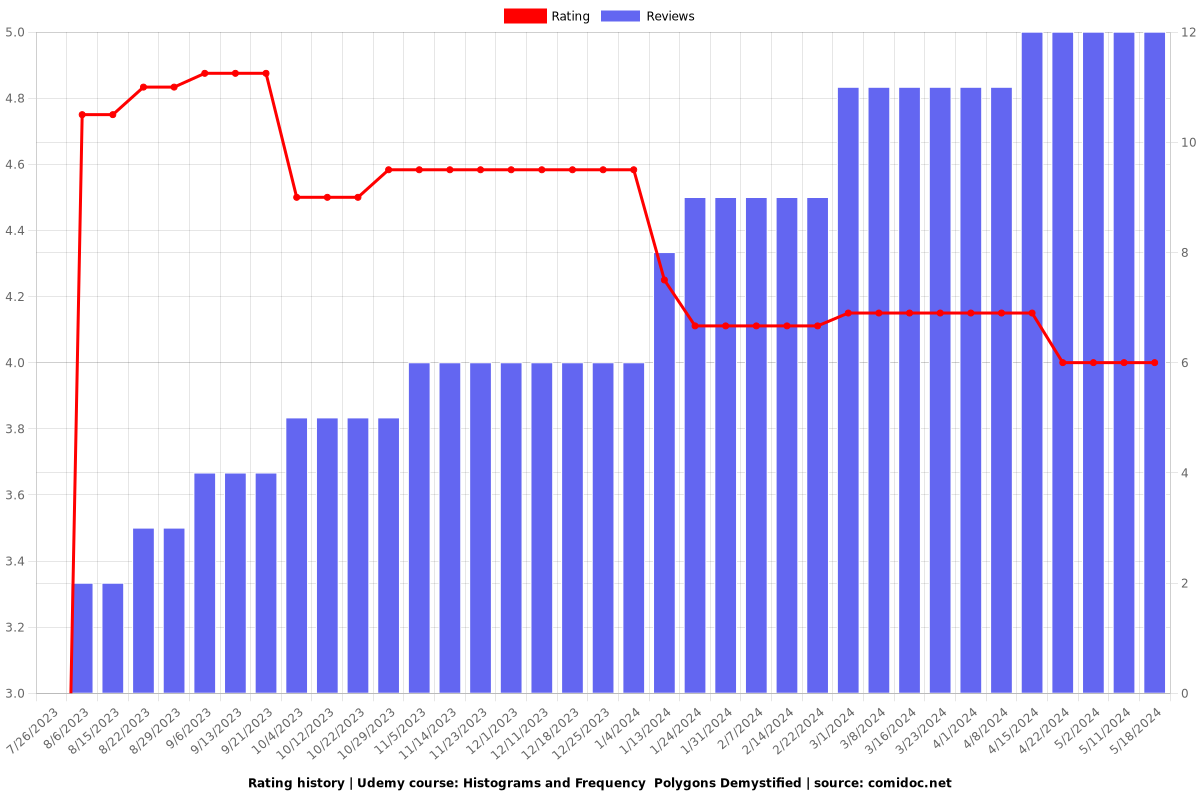
4.00 (12 reviews)

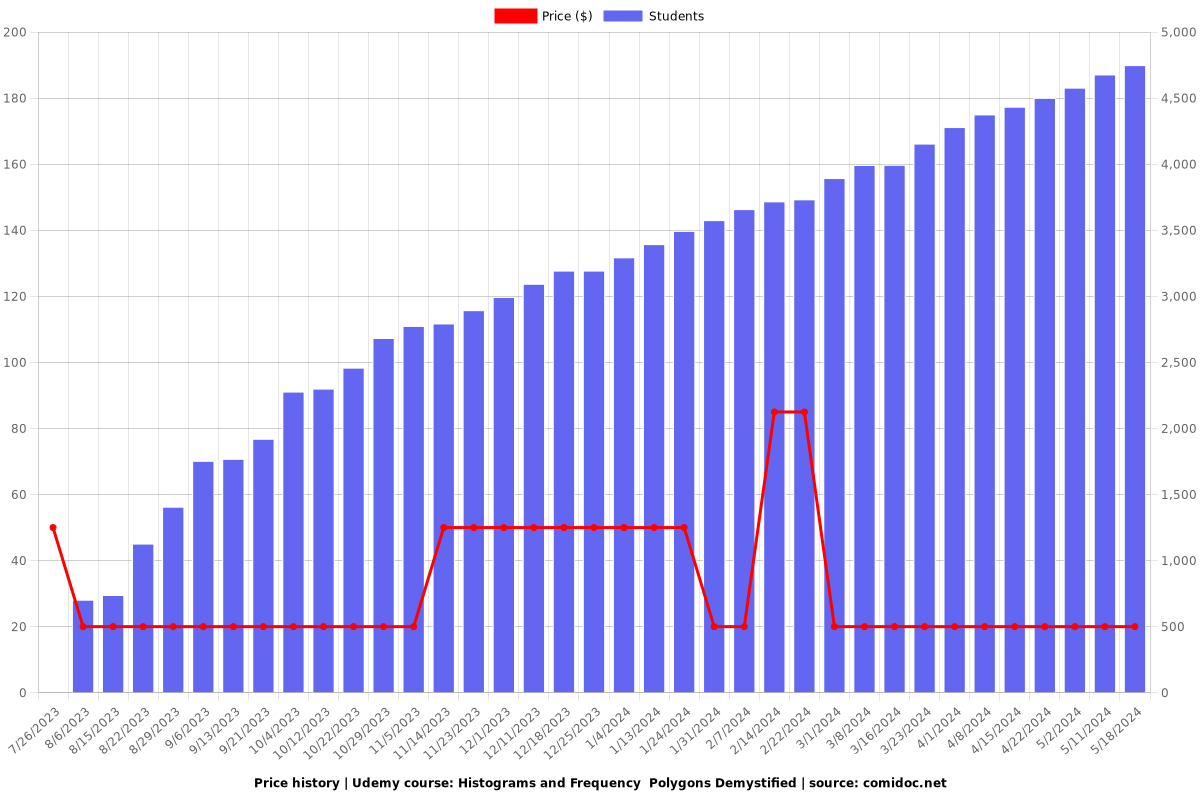
4,747
students
1 hour
content
Oct 2023
last update
$19.99
regular price
What you will learn
1. if the length of some leaves of a plant is measured and the data is represented by a table having discontinuous class intervals, then how to draw a histogram
2. Whether the data which is used to draw histogram, can be used to draw any other suitable graph.
3. If the data in respect of lifetimes of some neon lamps is given in the form of a table, how to represent the information with the help of a histogram.
4. If a table shows distribution of students in two sections according to the marks obtained by them, then how to use that data to form two frequency polygons o
Why take this course?
---
**Course Title:** Histograms and Frequency Polygons Demystified: Understanding and Creating Visual Representations of Data
**Course Description:**
Are you ready to transform your understanding of data into compelling visual stories? In this comprehensive course, *Prabh Kirpa* from Classes will guide you through the intricacies of histograms and frequency polygons. Dive deep into the world of data visualization and learn how to effectively represent large datasets with clarity and precision.
**Mastering Histograms:**
- **Understanding Data Intervals (📊)** : Learn how to convert a table of discrete class intervals into a continuous histogram, perfect for representing the length of plant leaves or any other data with discontinuous intervals.
- **Choosing the Right Representation**: Discover if there are alternative graphical methods better suited for your data than a histogram, and when to use them.
- **Histograms for Real-World Data (🔦)**: Understand how to represent real-world data, like the lifetimes of neon lamps, with histograms. Explore how to analyze the data to determine how many lamps have a lifetime exceeding a specified number of hours.
**Exploring Frequency Polygons:**
- **Two Sections, One Graph (📊)**: Learn how to visualize the distribution of students across two sections based on their marks using frequency polygons. This will not only simplify the data but also highlight the differences between the sections.
- **Class Intervals and Class Widths**: Get to grips with the concept of classes, class-size, lower class limits, and upper class limits. Understand how these terms are used to condense large datasets into manageable groups for visualization purposes.
- **Histogram vs. Frequency Polygon (🔍)**: While both histograms and frequency polygons serve the purpose of data representation, they have their differences. Learn when and why each might be the better choice for your dataset.
**Course Highlights:**
- **Engaging Content**: Engage with interactive examples and real-world scenarios that bring the concepts to life.
- **Expert Instruction (👩🏫)**: Benefit from Prabh Kirpa's expertise in data visualization, ensuring you understand both the theory and practical application behind each visual representation.
- **Hands-On Practice**: Apply what you learn through exercises and activities designed to reinforce your understanding of histograms and frequency polygons.
- **Visual Learning**: With a focus on visual learning, you'll be able to create and interpret these graphs with confidence, making you a valuable asset in any data analysis team.
**Why Take This Course?**
Whether you're a data analyst, educator, or simply someone interested in data visualization, this course will equip you with the skills to effectively communicate complex datasets through histograms and frequency polygons. Enroll now to unlock your data's story and become a proficient data visualizer! 🚀
---
Join us on this journey of discovery as we turn numbers into narratives. With *Prabh Kirpa* at the helm, you're guaranteed a learning experience that will demystify histograms and frequency polygons, making you an expert in visual data representation. Sign up for "Histograms and Frequency Polygons Demystified" today and take your first step towards becoming a data storyteller! 📊✨
Reviews
Muhammad
February 22, 2024
Course's duration is only 1 hour. It would have been nice if he increases the content of the course.
Explanation is very good
Charts
Price
Rating
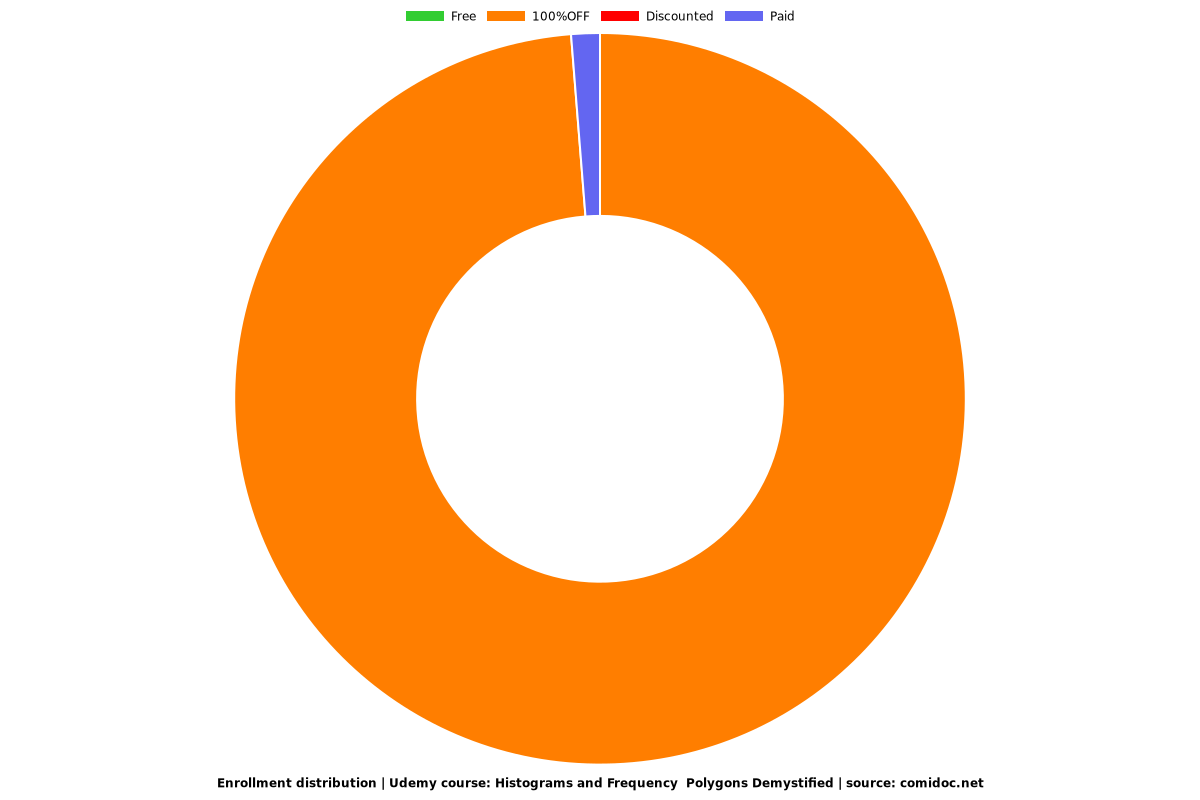
Enrollment distribution
5464636
udemy ID
7/25/2023
course created date
7/26/2023
course indexed date
Prabh Kirpa Classes
course submited by